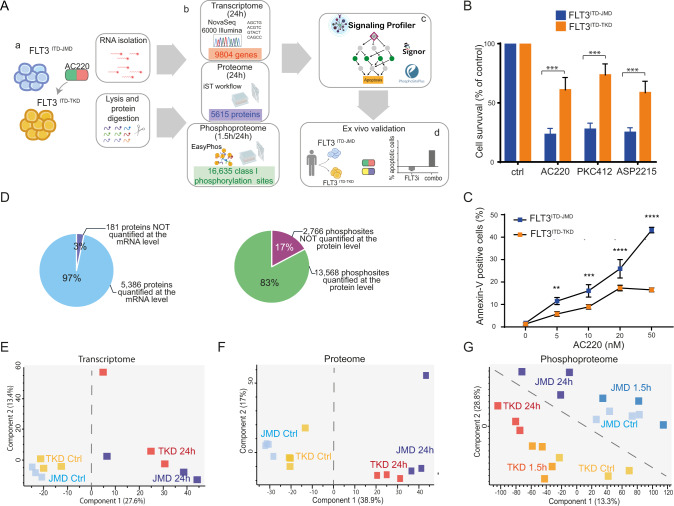
Fig. 1. The different ITD location affects the sensitivity to TKIs therapy modulating the phosphoproteome of FLT3-ITD cell lines.
A Overview of the experimental and bioinformatic strategy. BaF3 cells expressing FLT3ITD-TKD (in orange) and FLT3ITD-JMD (in blue) were treated with 20 nM quizartinib (AC220) for 24 h (a). mRNAs were isolated for the transcriptome analysis and the protein extracts were digested and characterized at the proteome and phosphoproteome levels (b). Multi-omics profiles of FLT3-ITD cells were used in SignalingProfiler pipeline to obtain cell-specific models and to identify additional druggable genes (c). Proteins of interest were further investigated through complementary assays in patients-derived primary blasts (d). B Cell survival of BaF3 cells expressing FLT3ITD-JMD (in blue) and FLT3ITD-TKD (in orange) after FLT3 inhibitors treatment. Cells were treated for 24 h with 20 nM quizartinib (AC220), 100 nM midostaurin (PKC412) and 50 nM gilteritinib (ASP2215). Cell viability was assessed by MTT assay. C Induction of apoptosis in BaF3 cells expressing FLT3ITD-JMD (in blue) and FLT3ITD-TKD (in orange) treated with increasing doses of AC220 for 24 h. The percentage of apoptotic cells was determined by Annexin-V labeling. D Pie charts representing the percentage and the number of species characterized at the protein and the transcript levels (top) or at the protein and the phosphosite levels (bottom). E–G Principal Component Analysis (PCA) of the analytes quantified across the transcriptome (E), proteome (F) and phosphoproteome (G) replicates.

