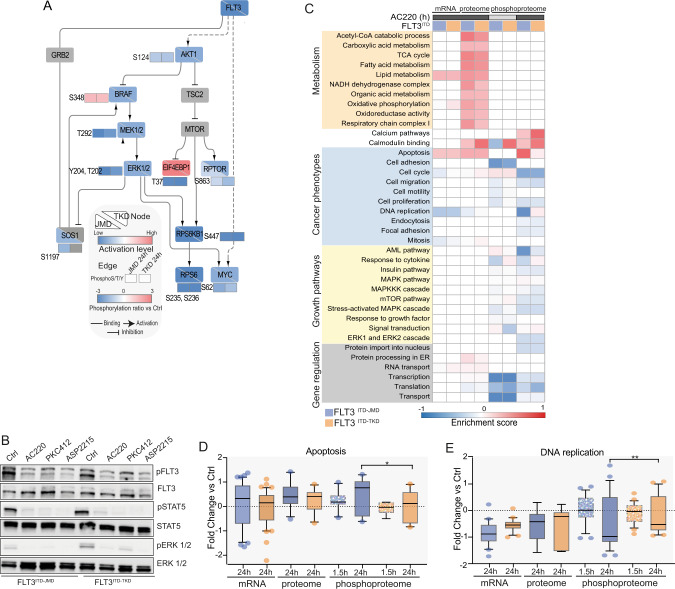
Fig. 2. AC220-induced remodelling of the proteome and the phosphoproteome of FLT3ITD-JMD and FLT3ITD-TKD cells.
A FLT3 downstream causal interaction network. The effect of quizartinib (AC220) on the phosphoproteome and proteome profiles of FLT3ITD-JMD and FLT3ITD-TKD cells was mapped on a literature curated signaling network, extracted from the SIGNOR resource [11]. For comparative analysis, for each node, the activation state in both cell line is shown (down-left half for ITD-JMD, and top-right half for ITD-TKD). Activated proteins are marked in red, whereas inhibited ones in blue. Phosphosites are displayed as independent rectangles and are colored according to their phosphorylation state after quizartinib treatment, as indicated in the legend. B Representative western blot showing the inhibition of canonical FLT3 downstream targets, as revealed by their phosphorylation status: Tyr694 in STAT5 and Thr202 and Tyr204 in ERK1/2. ITD-JMD and ITD-TKD BaF3 cells were treated for 1.5 h with FLT3 inhibitors treatment (AC220: quizartinib, PKC412: midostaurin and ASP2215: gilteritinib). C Heatmap displaying the enrichment score of GO Biological processes and KEGG pathways significantly (FDR < 0.05) over- (red color) or under- (blue color) represented in the relative dataset (transcripts, proteins and phosphosites in FLT3ITD-JMD (in blue) and FLT3ITD-TKD (in orange) BaF3 cells upon quizartinib (AC220) treatment. D, E Boxplots showing the relative abundance of significantly modulated transcripts, proteins and phosphoproteins involved in apoptosis (D) or DNA replication process (E) in BaF3 cells expressing FLT3ITD-JMD (in blue) and FLT3ITD-TKD (in orange) upon quizartinib (AC220) treatment.

