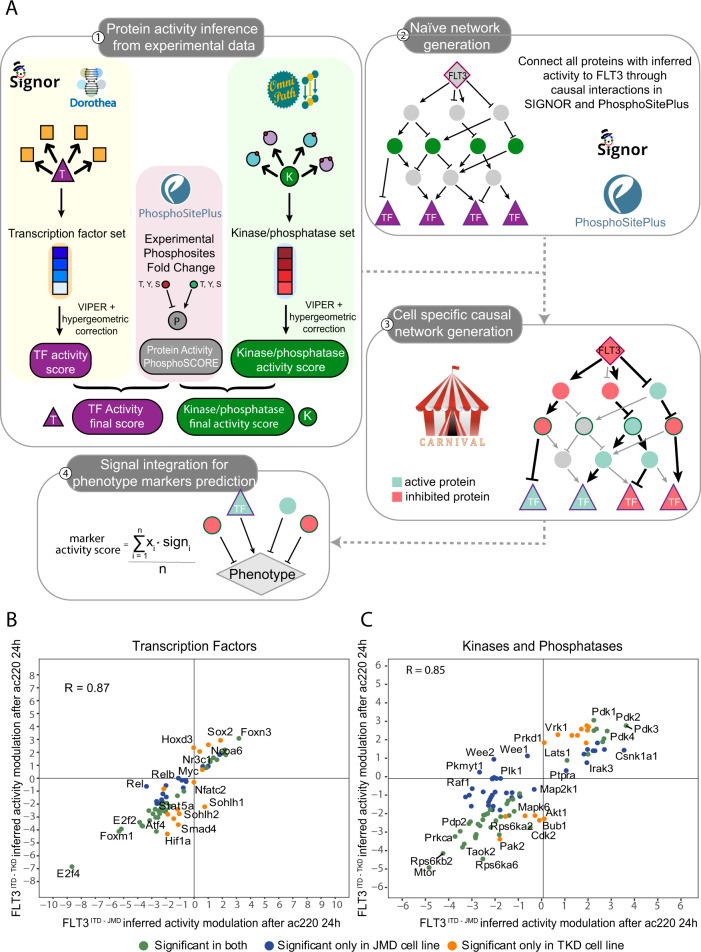
Fig. 3. SignalingProfiler strategy predicted an opposite regulation of the WEE1 protein family kinases activity between FLT3ITD-JMD and FLT3ITD-TKD cells.
A Schematic representation of the SignalingProfiler workflow. Step 1. Protein activity of transcription factors, kinases and phosphatases was computed from experimental data using the footprint-based analysis and the “phosphoSCORE” method. When needed, the two scores were averaged. Step 2. Proteins derived from step 1 were linked to FLT3 and to each other’s via paths of causal interactions extracted from PhosphoSitePlus and SIGNOR databases to build a naïve network. Step 3. CARNIVAL was used to search in the naïve network causal circuits coherent with protein activity. More specifically, in the first run we retrieved paths between FLT3 and kinases, phosphatases and substrates, whereas the second run connected all the proteins obtained from the first run with transcription factors. Eventually, the two networks were merged together. Step 4. The activity of protein markers of phenotypes (e.g., apoptosis) were predicted integrating the signal from upstream nodes in each cell-specific optimized network. B, C Protein activity prediction results. Scatterplots showing the comparison between protein activity predicted from FLT3ITD-JMD (x-axis) and FLT3ITD-TKD (y-axis) datasets for transcription factors (B) and kinases and phosphatases (C). Each dot represents a gene/protein, and the color indicates whether the prediction is statistically significant in both cell lines (green) or exclusively in one cell line: ITD-JMD (blue) or ITD-TKD (orange). R indicates Pearson correlation.

