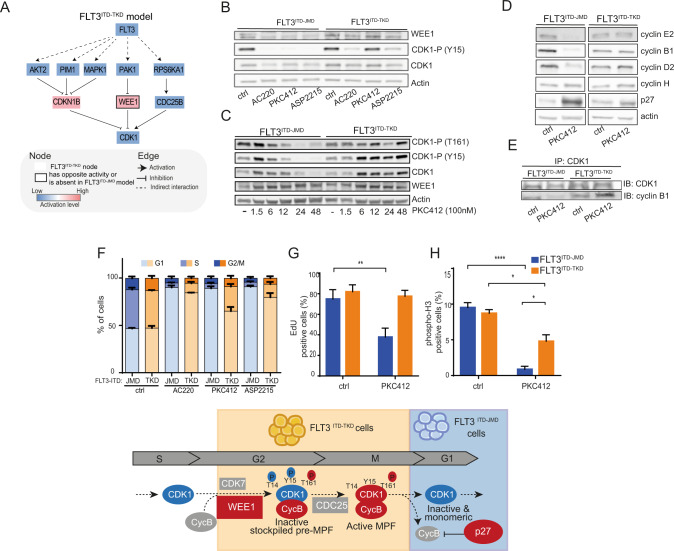
Fig. 4. The ITD location affects the WEE1-CDK1 axis and the regulation of the cell cycle upon TKIs treatment.
A FLT3 - CDK1 signal cascade. FLT3ITD-TKD specific mechanistic model highlighting the regulation of CDK1 downstream of FLT3. Activated proteins are marked in red, whereas inhibited ones in blue. Black bordered nodes display opposite or no regulation in FLT3ITD-JMD model. B Representative western blot showing the phosphorylation level of CDK1 on Tyr15 and the protein level of WEE1 kinase in FLT3ITD-JMD and FLT3ITD-TKD BaF3 cells treated for 24 h with 20 nM quizartinib (AC220), 100 nM midostaurin (PKC412) and 50 nM gilteritinib (ASP2215). C Representative western blot showing the phosphorylation level of CDK1 on Tyr15, Thr161 and the protein level of WEE1 kinase in FLT3ITD-JMD and FLT3ITD-TKD BaF3 cells treated for the indicated time points with 100 nM midostaurin (PKC412). D Representative western blot showing the protein level of different cyclins and p27 inhibitor in FLT3ITD-JMD and FLT3ITD-TKD Ba/F3 cells treated for 24 h with 100 nM midostaurin (PKC412). E Representative western blot showing the amount of cyclin B1 isolated by CDK1 immunoprecipitation in FLT3ITD-JMD and FLT3ITD-TKD Ba/F3 cells treated for 24 h with 100 nM midostaurin (PKC412). F Cell cycle analysis. Boxplots displaying the percentage of FLT3ITD-JMD (in blue) and FLT3ITD-TKD (in orange) cells in the different phases of the cell cycle as determined by flow cytometry using DAPI labeling, after treatment for 24 h with 20 nM quizartinib (AC220), 100 nM midostaurin (PKC412) and 50 nM gilteritinib (ASP2215). G Effect of midostaurin on cell division. FLT3ITD-JMD (blue) and FLT3ITD-TKD (orange) BaF3 cells were treated with 100 nM midostaurin (PKC412) for 24 h. Percentage of cells in division was assessed by EdU labeling and flow cytometry analysis. H Bar plot representing the percentage of cells in mitosis. FLT3ITD-JMD (blue) and FLT3ITD-TKD (orange) BaF3 cells were treated with 100 nM PKC412 for 24 h. Cells expressing phospho-H3 (S10) were identified by flow cytometry analysis. WEE1 – CDK1 mechanistic model. I Cartoon representing the potential molecular mechanism of chemoresistance suggested by the SignalingProfiler analysis. TKI treated FLT3ITD-JMD are stacked in the G1 phase through the accumulation of a monomeric, inactive pool of CDK1, whereas TKI treated FLT3ITD-TKD cells can progress through the cell cycle thanks to the accumulation of the CDK1-Cyclin B complex.

