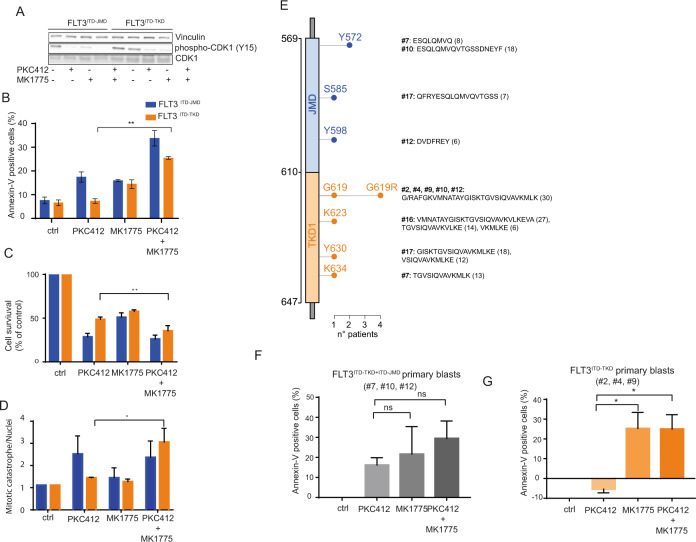
Fig. 5. WEE1 kinase inhibition sensitizes FLT3ITD-TKD cells and primary blasts to TKI treatment.
A Representative western blot showing the effect of the WEE1 inhibitor, adavosertib, on the phosphorylation levels of CDK1 on tyrosine 15. FLT3ITD-JMD and FLT3ITD-TKD BaF3 cells were treated with 100 nM PKC412, 500 nM adavosertib (MK1775) and the combination of both for 24 h. B FLT3ITD-JMD (blue) and FLT3ITD-TKD (orange) BaF3 cells were treated with 100 nM midostaurin (PKC412), 500 nM adavosertib (MK1775) and the combination of both for 24 h. Percentage of apoptotic cells was assessed by Annexin-V labeling. C FLT3ITD-JMD (blue) and FLT3ITD-TKD (orange) BaF3 cells were treated with 100 nM midostaurin (PKC412), 500 nM adavosertib (MK1775) and the combination of both for 24 h. Cell survival relative to control after treatment was calculated by MTT assay. D FLT3ITD-JMD (blue) and FLT3ITD-TKD (orange) BaF3 cells were treated with 100 nM midostaurin (PKC412), 500 nM adavosertib (MK1775) and the combination of both for 24 h. Percentage of mitotic catastrophe was assessed by DAPI labeling of nuclei. E Lollipop plot representing the location, amino acid sequence and length of FLT3-ITD mutations in the 9 patients analyzed. 4 patients have ITD located in TKD1 domain (#2, #4, #16, #19), 5 in both TKD1 and JMD domain (#1, #7, #10, #12, #17). Each lollipop length represents the number of patients having an ITD in that position. All mutations were derived from Sanger sequencing from primary patient blasts. F Barplot showing the percentage of treatment-induced apoptosis (100 * (dead cells after treatment – death cells in control) / viable cells in control) in patient-derived blasts carrying FLT3-ITD in both the JM and the TK1 domains upon the indicated treatments (patients: #7, #10, #12). Percentage of apoptotic cells was assessed by Annexin-V labeling. G Barplot showing the percentage of treatment-induced apoptosis (100 * (dead cells after treatment – death cells in control) / viable cells in control) in patient-derived blasts carrying FLT3-ITD exclusively in the TK1 domain upon the indicated treatments (patients: #2, #4, #19). Percentage of apoptotic cells was assessed by Annexin-V labeling.

