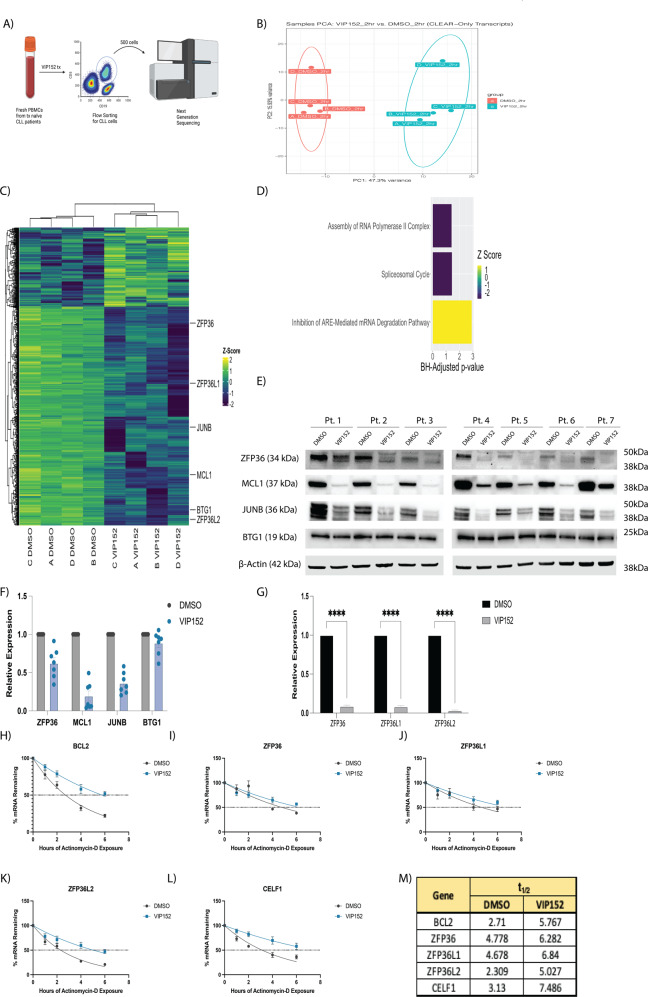
Fig. 3. VIP152 induces rapid transcriptomic changes.
A Schematic cartoon of limiting-cell RNA-seq experiment. B Principal component analysis of RNA sequencing data. Each dot represents a unique patient sample treated with either DMSO (red) or 1 µM VIP152 (teal). C Heat map of most differentially expressed genes. Genes selected by overall DEG’s with a LFC > 1 or LFC < −1 adj. p-value < 0.05. D Plot of pathways from Ingenuity Pathway Analysis with p-value < 0.05 and z-score > 0 or z-score < 0. E–G 7 CLL patient samples were treated for 8 h with 1 µM VIP152 and then analyzed for protein expression by western blot (E, F) and ZFP36, ZFP36L1, and ZFP36L2 expression by qRT-PCR (G). H–L 5 CLL patient samples were treated for 8 h with 1 µM VIP152 and then supplemented with 500 nM Actinomycin-D. RNA was taken at varying timepoints and analyzed via qRT-PCR. M mRNA half-lives of analyzed transcripts in (H–L) as determined by nonlinear regression using a one-phase decay method.

