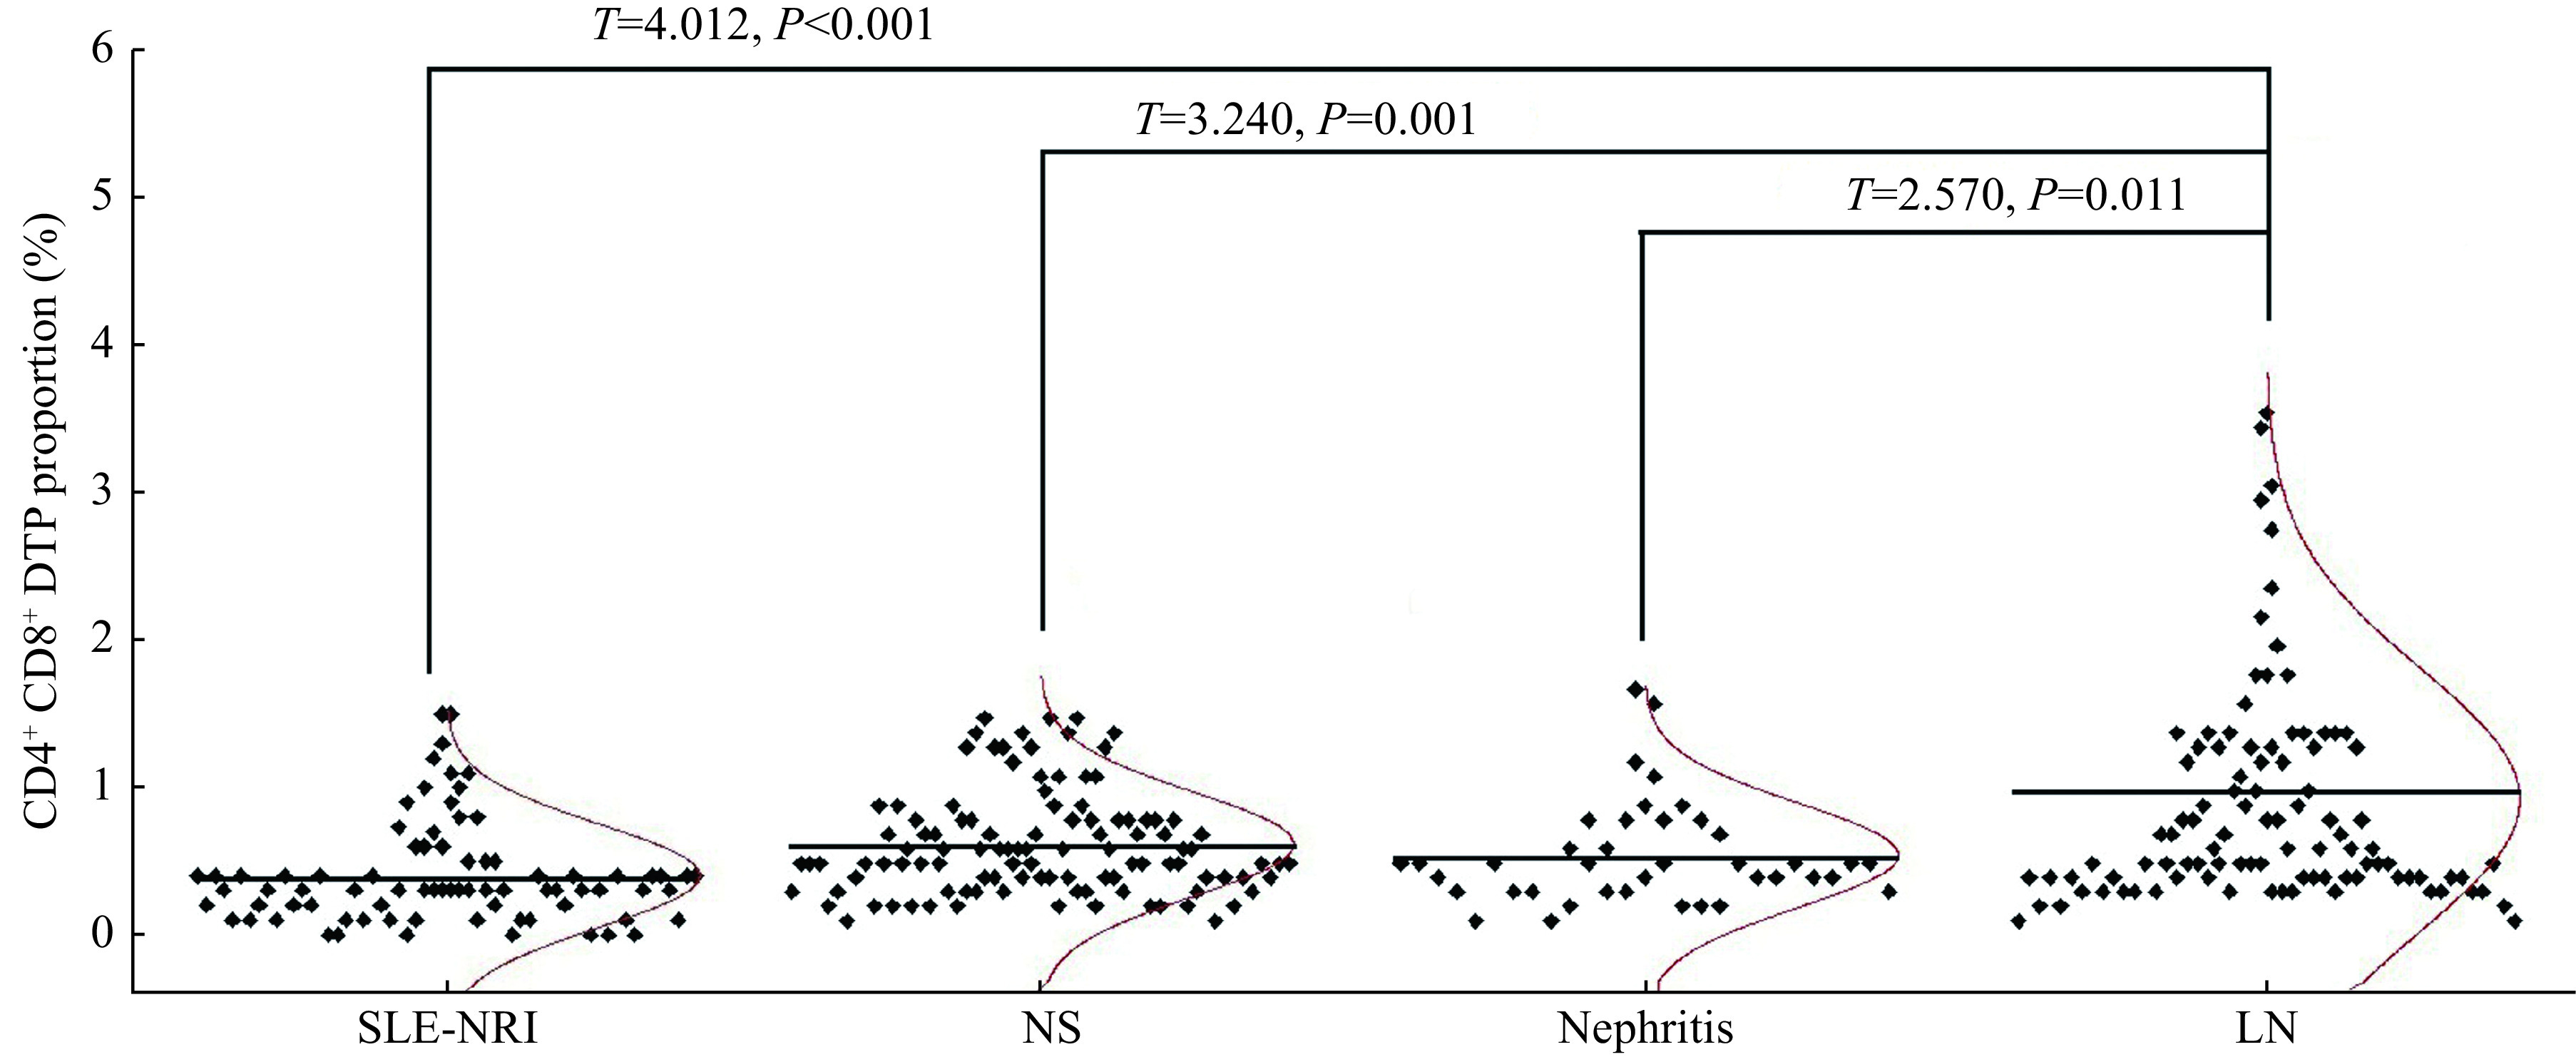
Figure 4.

Comparative analysis and distribution map of CD4+CD8+ DPT in four groups.
The CD4+CD8+ DPT proportions in the groups of NS (N=108), nephritis (N=108), and LN (N=100) were compared with the SLE-NRI group (N=79), respectively. Comparisons between two groups were performed by Student's t-test. SLE-NRI: systemic lupus erythematosus without renal impairment; LN: lupus nephritis; NS: nephritic syndrome.
