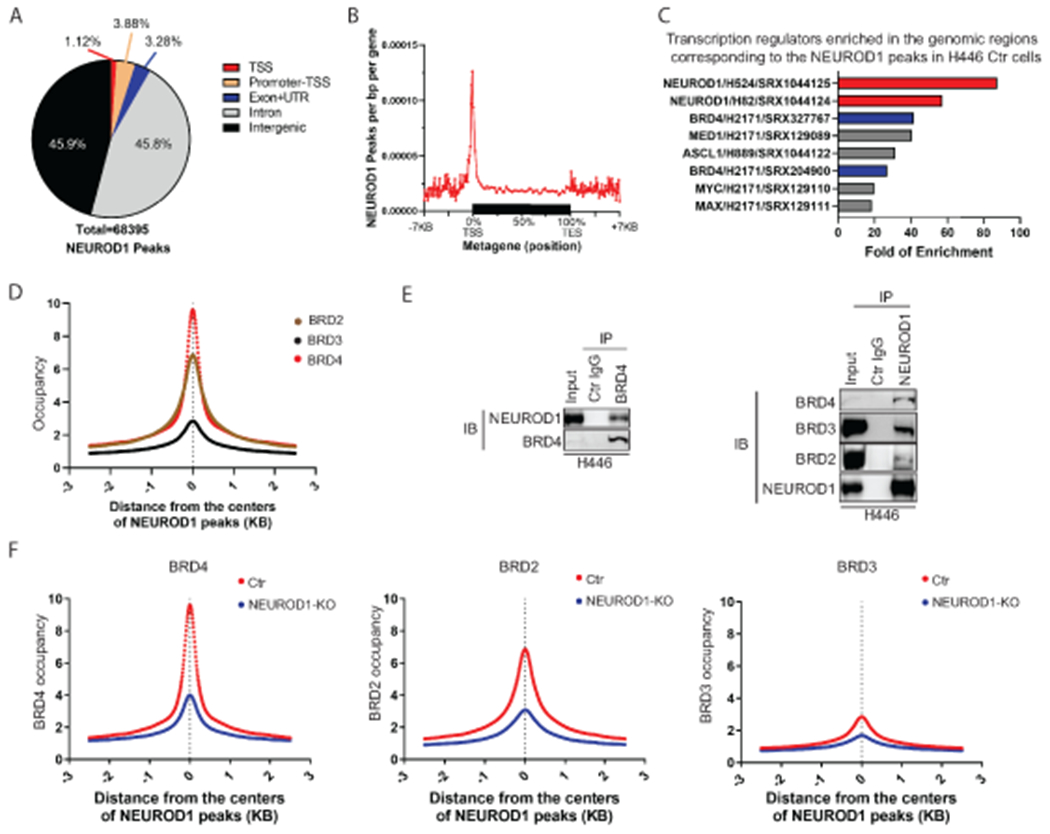
Figure 2. NEUROD1 interacts with BET proteins and defines their genomic landscapes in SCLC.

A) A breakdown of the genomic locations of the NEUROD1 peaks identified by ChIP-seq in H446 control cells (control gRNA). B) A metagene profile of NEUROD1 occupancy in H446 control cells. C) The bar graph shows the top eight TF candidates identified by an Enrichment Analysis (ChIP-Atlas, RRID:SCR_015511) that occupy the genomic regions in other lung cells corresponding to the NEUROD1 peaks in H446 control cells. NEUROD1 and BRD4 were highlighted. D) BRD2, BRD3, and BRD4 occupancy near the centers of NEUROD1-occupied regions in H446 control cells (2.5 kilobases [KB] bilateral). E) Co-IP assays using H446 nuclear extracts. Left, detection of NEUROD1 after BRD4 IP; right, detection of BRD2, BRD3, and BRD4 after NEUROD1 IP. F) Effect of NEUROD1 KO on BRD4, BRD2, and BRD3 occupancy near the centers of the NEUROD1-occupied regions in H446 control cells. Ctr, control; KO, knockout; IB, immunoblotting; IP, immunoprecipitation; TSS, transcription start site; TES, transcription end site; UTR, untranslated region.
