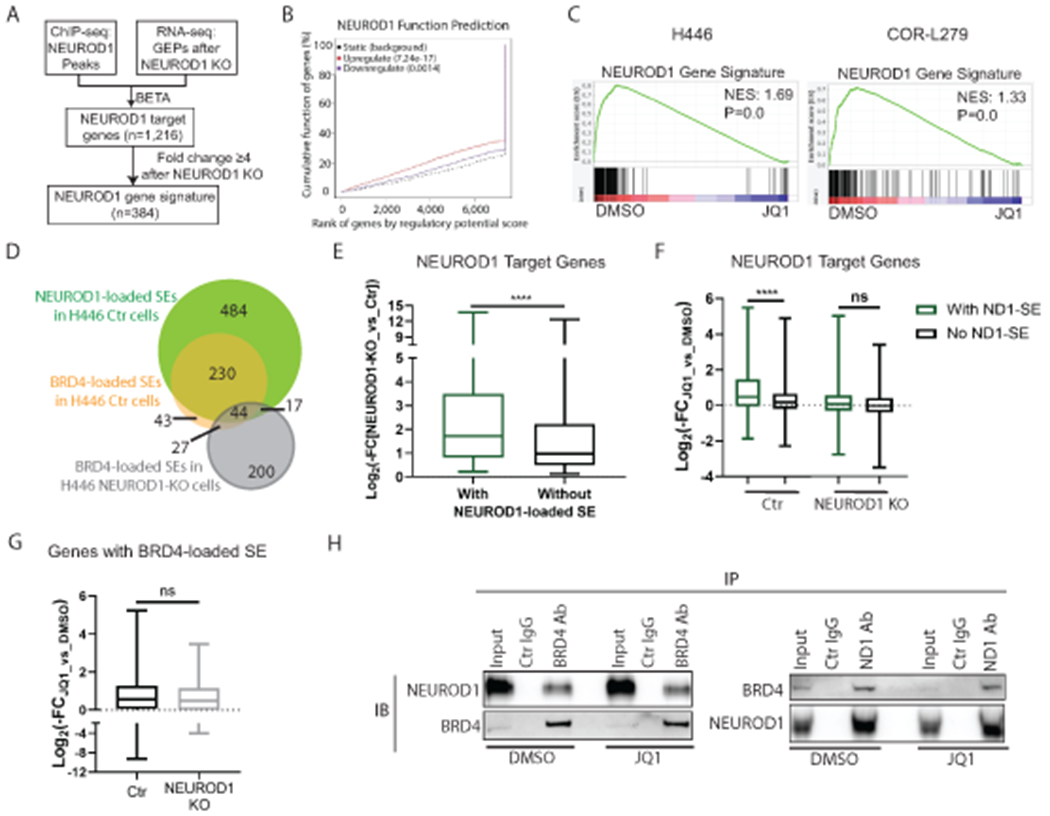
Figure 3. BETi suppresses NEUROD1-target genes, particularly those associated with superenhancers.

A) A flow chart illustrating the procedures to identify NEUROD1-target genes and to constitute a NEUROD1 gene signature. B) The BETA algorithm predicts that NEUROD1 primarily functions as a transcriptional activator (red curve). C) GSEA plots showing depletion of NEUROD1 gene signature after 24-hr JQ1 treatment in H446 (left; 1 μM) and COR-L279 cells (right; 0.5 μM). D) Venn diagrams show the overlaps between the NEUROD1- and BRD4-loaded SEs in H446 control and NEUROD1-KO cells. E) Comparing the effects of NEUROD1 KO on the expression of the NEUROD1-target genes with NEUROD1-loaded SEs and those without in H446 control cells. F) Differential effects of JQ1 (1μM, 24 hrs) on the expression of the NEUROD1-target genes (with or without the NEUROD1-loaded SEs) in H446 control cells (left two bars) versus the NEUROD1-KO cells (right two bars). G) JQ1 (1μM, 24 hrs) suppressed the genes with BRD4-loaded SEs in H446 control cells (n=307) and those in NEUROD1-KO cells (n=258). H) co-IP of BRD4 or NEUROD1 using the nuclear extract from H446 cells treated with JQ1 (1μM, 6 hrs). Left, detection of NEUROD1 after IP of BRD4. Right, detection of BRD4 after IP of NEUROD1. Whiskers represent minimum to maximum, and boxes show the first, median, and third quartile (E-G). The significance of two-group comparisons was determined using the Student’s t-test (E-G). ****, P<0.0001; ns: not significant. BETA, the Binding and Expression Target Analysis; FC, fold change; GEP, gene expression profile; IB, immunoblotting; IP, immunoprecipitation; NES, normalized enrichment score; SE; superenhancer.
