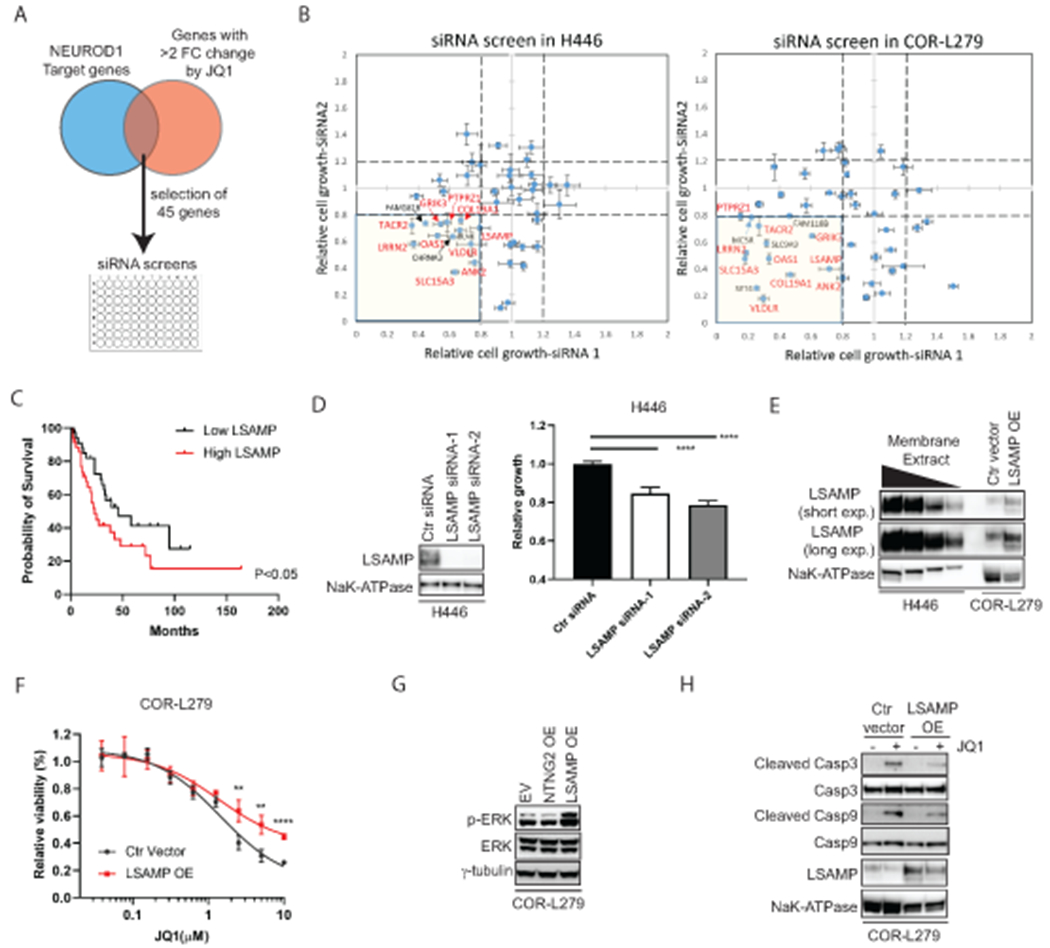
Figure 5. LSAMP, a NEUROD1-target gene, partially mediates BETi sensitivity.

A) A diagram depicts the selection of 45 genes regulated by both NEUROD1 and BET proteins for siRNA screens. B) The results of siRNA screens (72 hrs) in H446 (left) and COR-L279 cells (right). The genes highlighted in red are the shared candidate genes between H446 and COR-L279 cells showing ≥ 20% growth inhibition upon knockdown with each of two distinct siRNAs. C) Kaplan-Meier curves show an inverse correlation between LSAMP expression and the overall survival in SCLC patients (N=69; ref. (39)). The patients were dichotomized on the basis of LSAMP transcript levels in the tumors (top 50% vs. bottom 50%). D) H446 proliferation was suppressed by LSAMP knockdown using two siRNAs distinct from the ones in the initial screens (B). Left, LSAMP expression in the membrane fractions of the knockdown cells. NaK-ATPase serves as a loading control. Right, the effect of LSAMP knockdown on H446 proliferation (measured by the CellTiter Glo 2.0 assay) at 72 hrs post-transfection. E) Stable expression of ectopic LSAMP in COR-L279 cells. A tapering amount of membrane protein from H446 (20, 10, 5, 2.5 μg) was loaded and compared with 20 μg membrane protein from the COR-L279 cells with or without ectopic LSAMP. F) Differential sensitivity to JQ1 (72 hrs) between the COR-L279 cells with ectopic LSAMP and those with control vector. G) Western blots show increased ERK phosphorylation in the COR-L279 cells following the overexpression of LSAMP, but not NTNG2. H) JQ1 (5μM, 24 hrs) induced less caspase 3 and 9 cleavage in the COR-L279 cells with ectopic LSAMP than in control. The significance of two-group comparisons was determined using the Log-rank test (C), the ANOVA test with Dunnett’s multiple test correction (D, right panel), and the Student’s t-test with multiple test correction (F). **, P<0.01; ****, P<0.0001. Ctr, control; FC, fold change; OE, overexpression.
