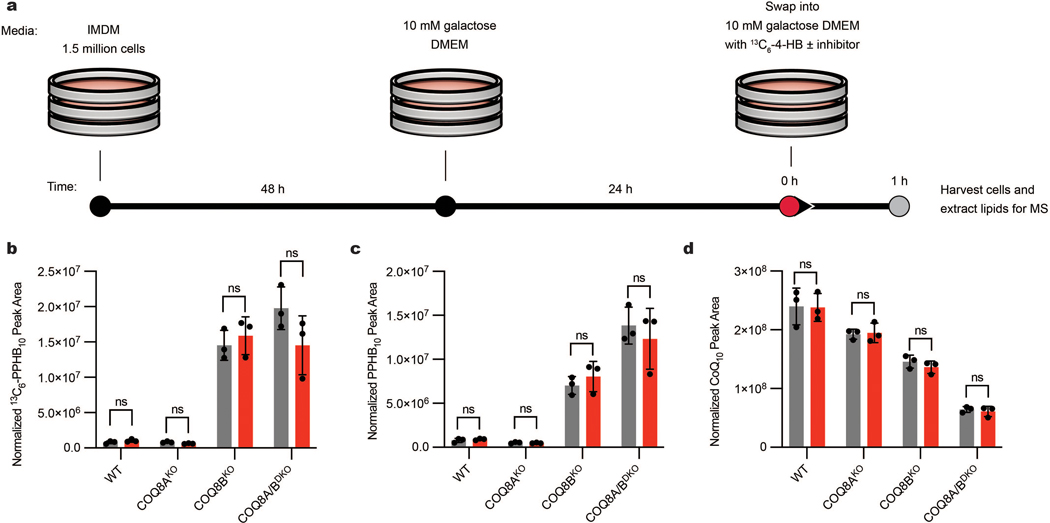
Extended Data Fig. 2. De novo CoQ10 biosynthesis measurements.
a, Schematic outlining the experimental plan to measure de novo CoQ production. b, De novo production of 13C6-PPHB10 in WT, COQ8AKO, COQ8BKO, and COQ8A/BDKO HAP1 cells after treatment with 10 μM 13C6-4-HB and either DMSO or 20 μM UNC-CA157 (grey=DMSO, red=UNC-CA157, n=3 independent samples from one experiment, mean ± SD) (two sided students t-test, no adjustment for multiple comparisons). c, Unlabeled PPHB10 levels in WT, COQ8AKO, COQ8BKO, and COQ8A/BDKO HAP1 cells after treatment with 10 μM 13C6-4-HB and either DMSO or 20 μM UNC-CA157 (grey=DMSO, red=UNC-CA157, n=3 independent samples from one experiment, mean ± SD) (two sided students t-test, no adjustment for multiple comparisons). d, Unlabeled CoQ10 levels in WT, COQ8AKO, COQ8BKO, and COQ8A/BDKO HAP1 cells after treatment with 10 μM 13C6-4-HB and either DMSO or 20 μM UNC-CA157 (grey=DMSO, red=UNC-CA157, n=3 independent samples from one experiment, mean ± SD) (two sided students t-test, no adjustment for multiple comparisons).

