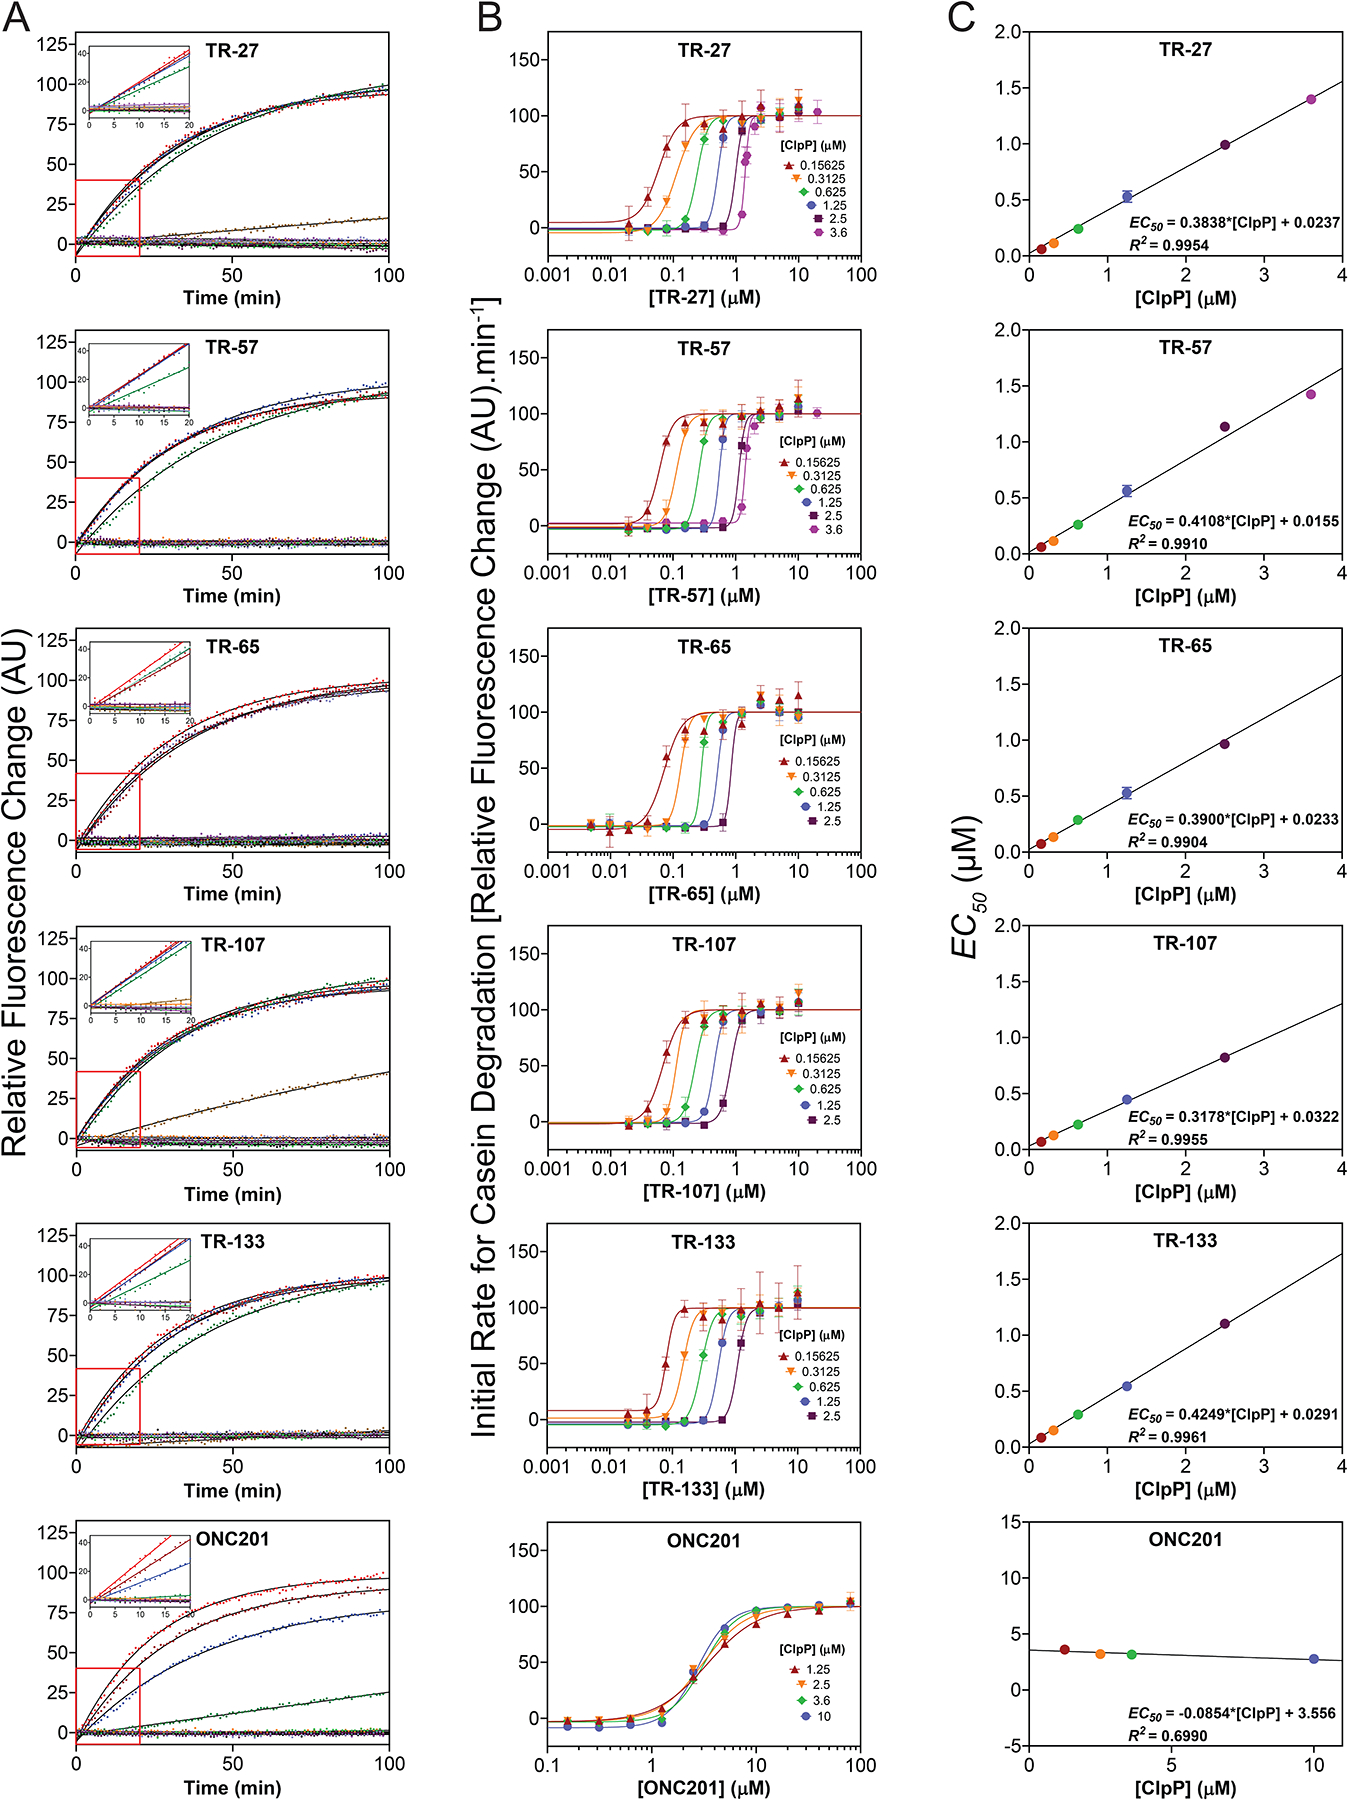
Figure 2. Measurement of the affinity of TR compound to ClpP by casein-FITC degradation.

(A) Shown are representative curves of casein-FITC degradation by 2.5 μM ClpP in the presence of different concentrations of each compound from 0–10 μM for the TR compounds and 0–80 μM for ONC201. Data were normalized to the highest drug concentration reaction. Experiments were repeated at least three times. Solid black lines show fits to single exponentials. Insets show the linear fits from 0 to 20 min.
(B) EC50 for TR compound binding to ClpP were determined by fitting the change in initial degradation velocity of casein-FITC by compound-activated ClpP as a function of compound concentration to the Hill equation (see Methods). The data and fits are shown as semilog plots. Legends indicate the ClpP concentration for each fit. The data points in the absence of TR compound are not shown. Error bars represent the standard deviations from the average of three repeats.
(C) Kd, app for TR compound binding to ClpP were determined by fitting the EC50 obtained from B as a function of ClpP concentration to a straight line (see Methods). The Y-intercept of each plot represents the Kd, app value. The equations and R2 values are shown. Error bars represent the standard deviations from the average of three repeats. Kd,app values are also listed in Table 1.
