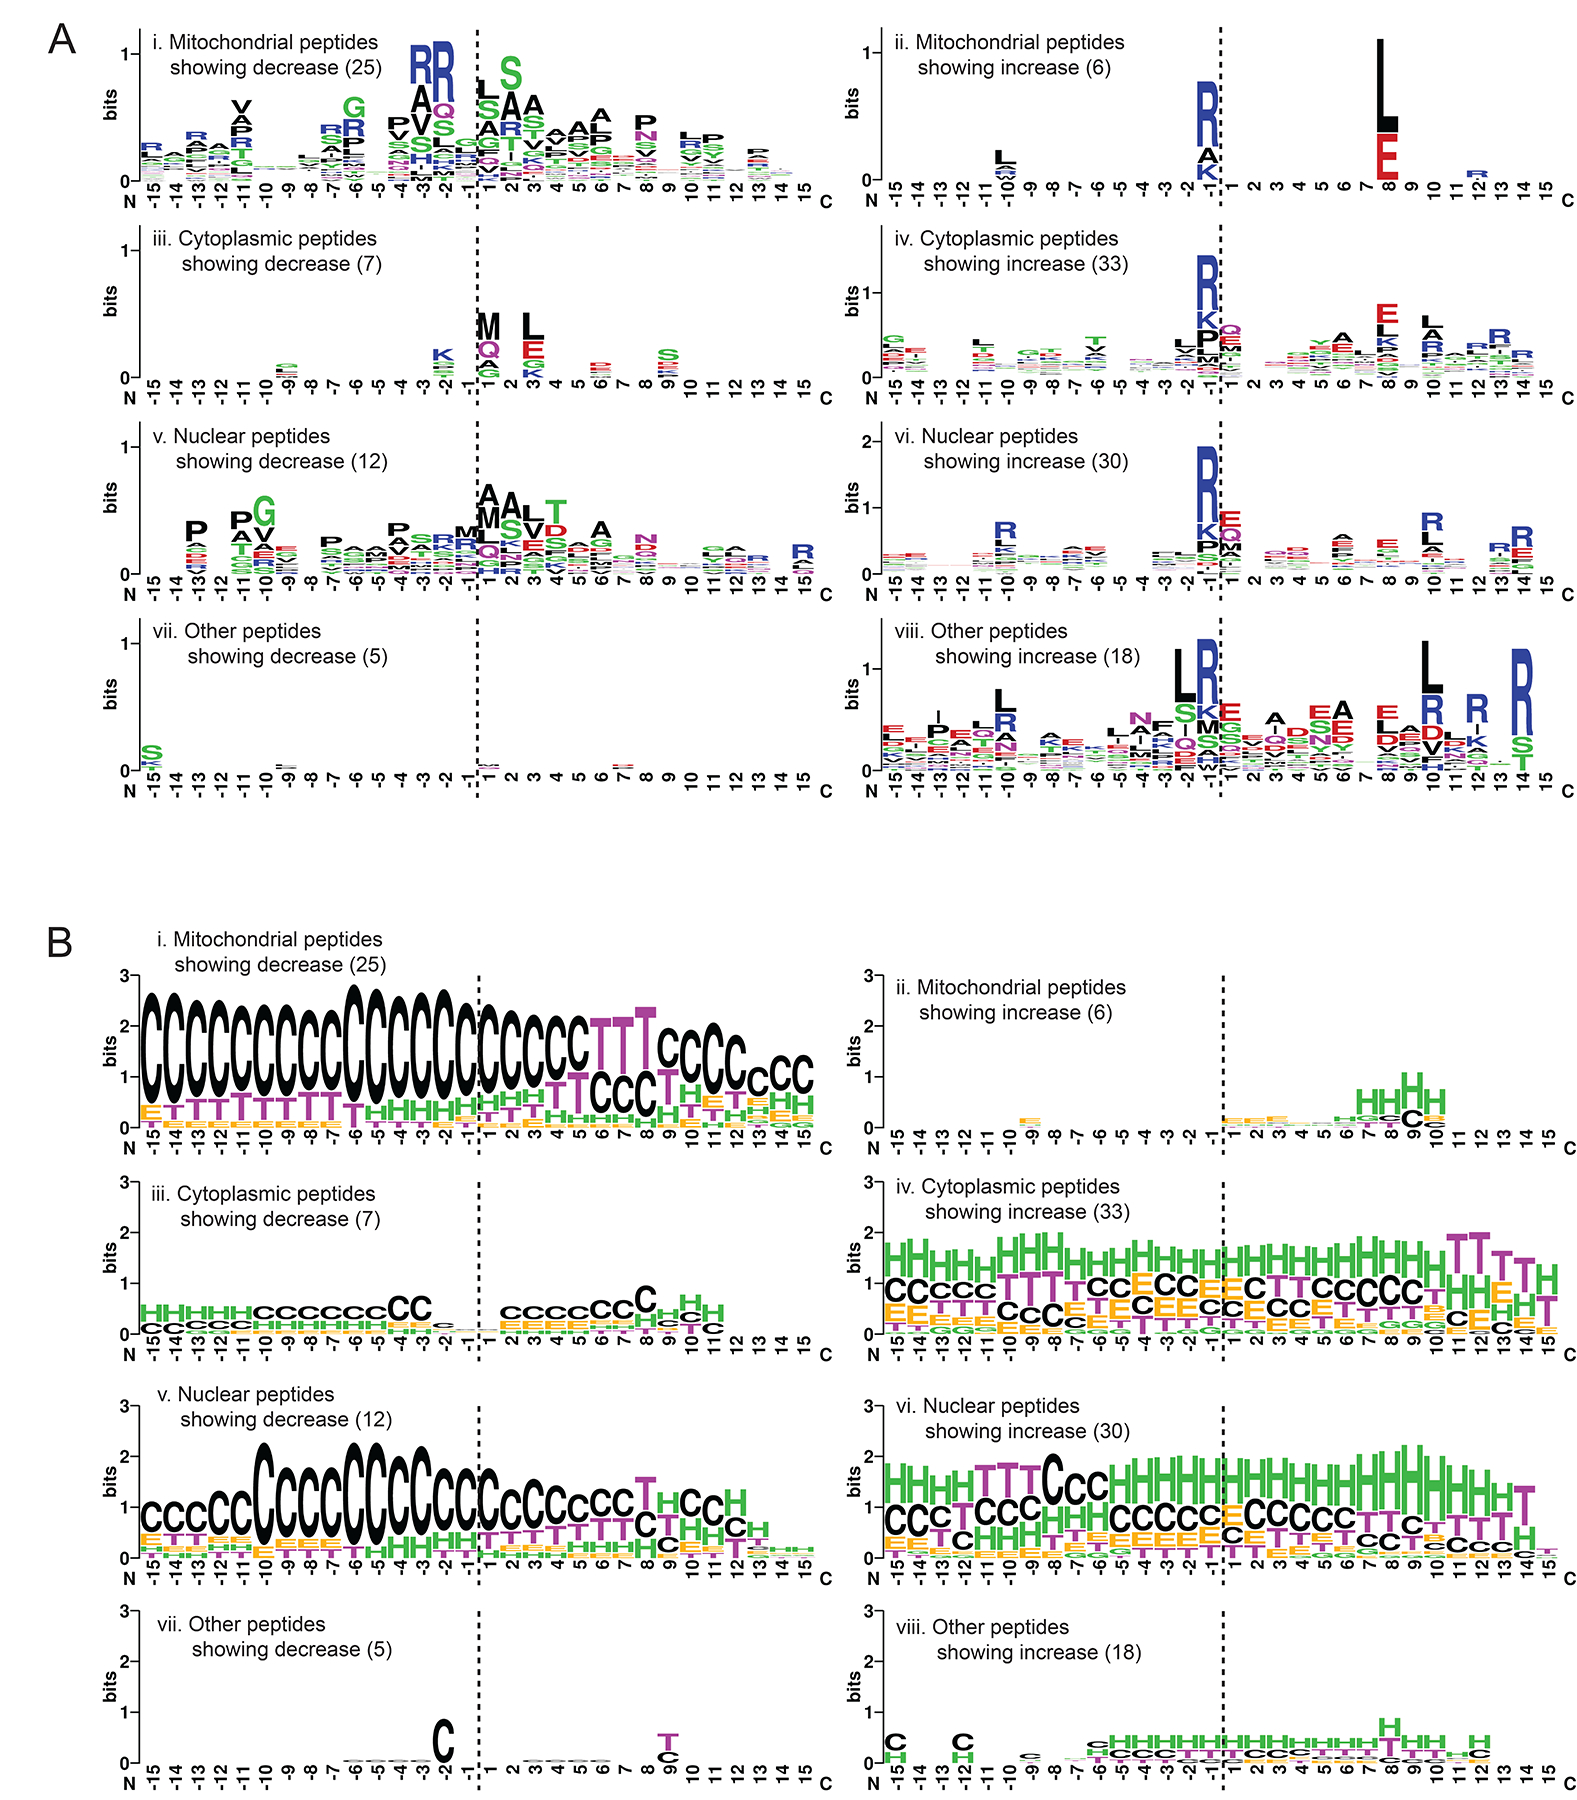
Figure 6. Characterization of the sequence and structural properties of the novel N-terminomes generated upon TR-27-induced ClpP-dependent proteolysis of cellular proteins.

(A) Analysis of the 30-residue sequences representing the 15 residues flanking both sides of the the cleavage site (horizontal dashed line) generating the novel N-terminus. Sequences were categorized by the subcellular localization of their originating proteins. Depleted peptides (left panel) were analyzed separately from accumulated ones (right panel), with the number of sequences included per analysis shown in brackets. The results are presented in WebLogo format using default settings of the WebLogo online generator44. The residues N-terminal of the cleavage site are labeled on the x-axis from −15 to −1 and those C-terminal are labeled from 1 to 15. The y-axis is shown in bits (information unit) that corresponds to the entropy of amino acid variation with maximum entropy being log2 20 (amino acids) = 4.3 bits.
(B) Secondary structural analysis of the 30-residue sequences described in A. The required structural information was extracted from the Protein Data Bank (PDB) of the originating proteins with solved X-ray or NMR structures. Otherwise, the information was obtained using primary sequence-based structural predictions generated by AlphaFold39, either as existing models already generated and curated at the AlphaFold Protein Structure Database (URL: https://alphafold.ebi.ac.uk/) or as de novo predictions following the published AlphaFold protocol. The results are shown in the WebLogo format using the following settings: G = 310 helix, H = α-helix and I = Π-helix are colored green; E = extended β-strand and B = isolated β-bridge are colored orange; T = H-bond turn is colored purple; S = non-H-bond bend is colored blue; C = unstructured coil is colored black. The y-axis is shown in bits, with maximum entropy at log2 8 (secondary structures) = 3 bits.
