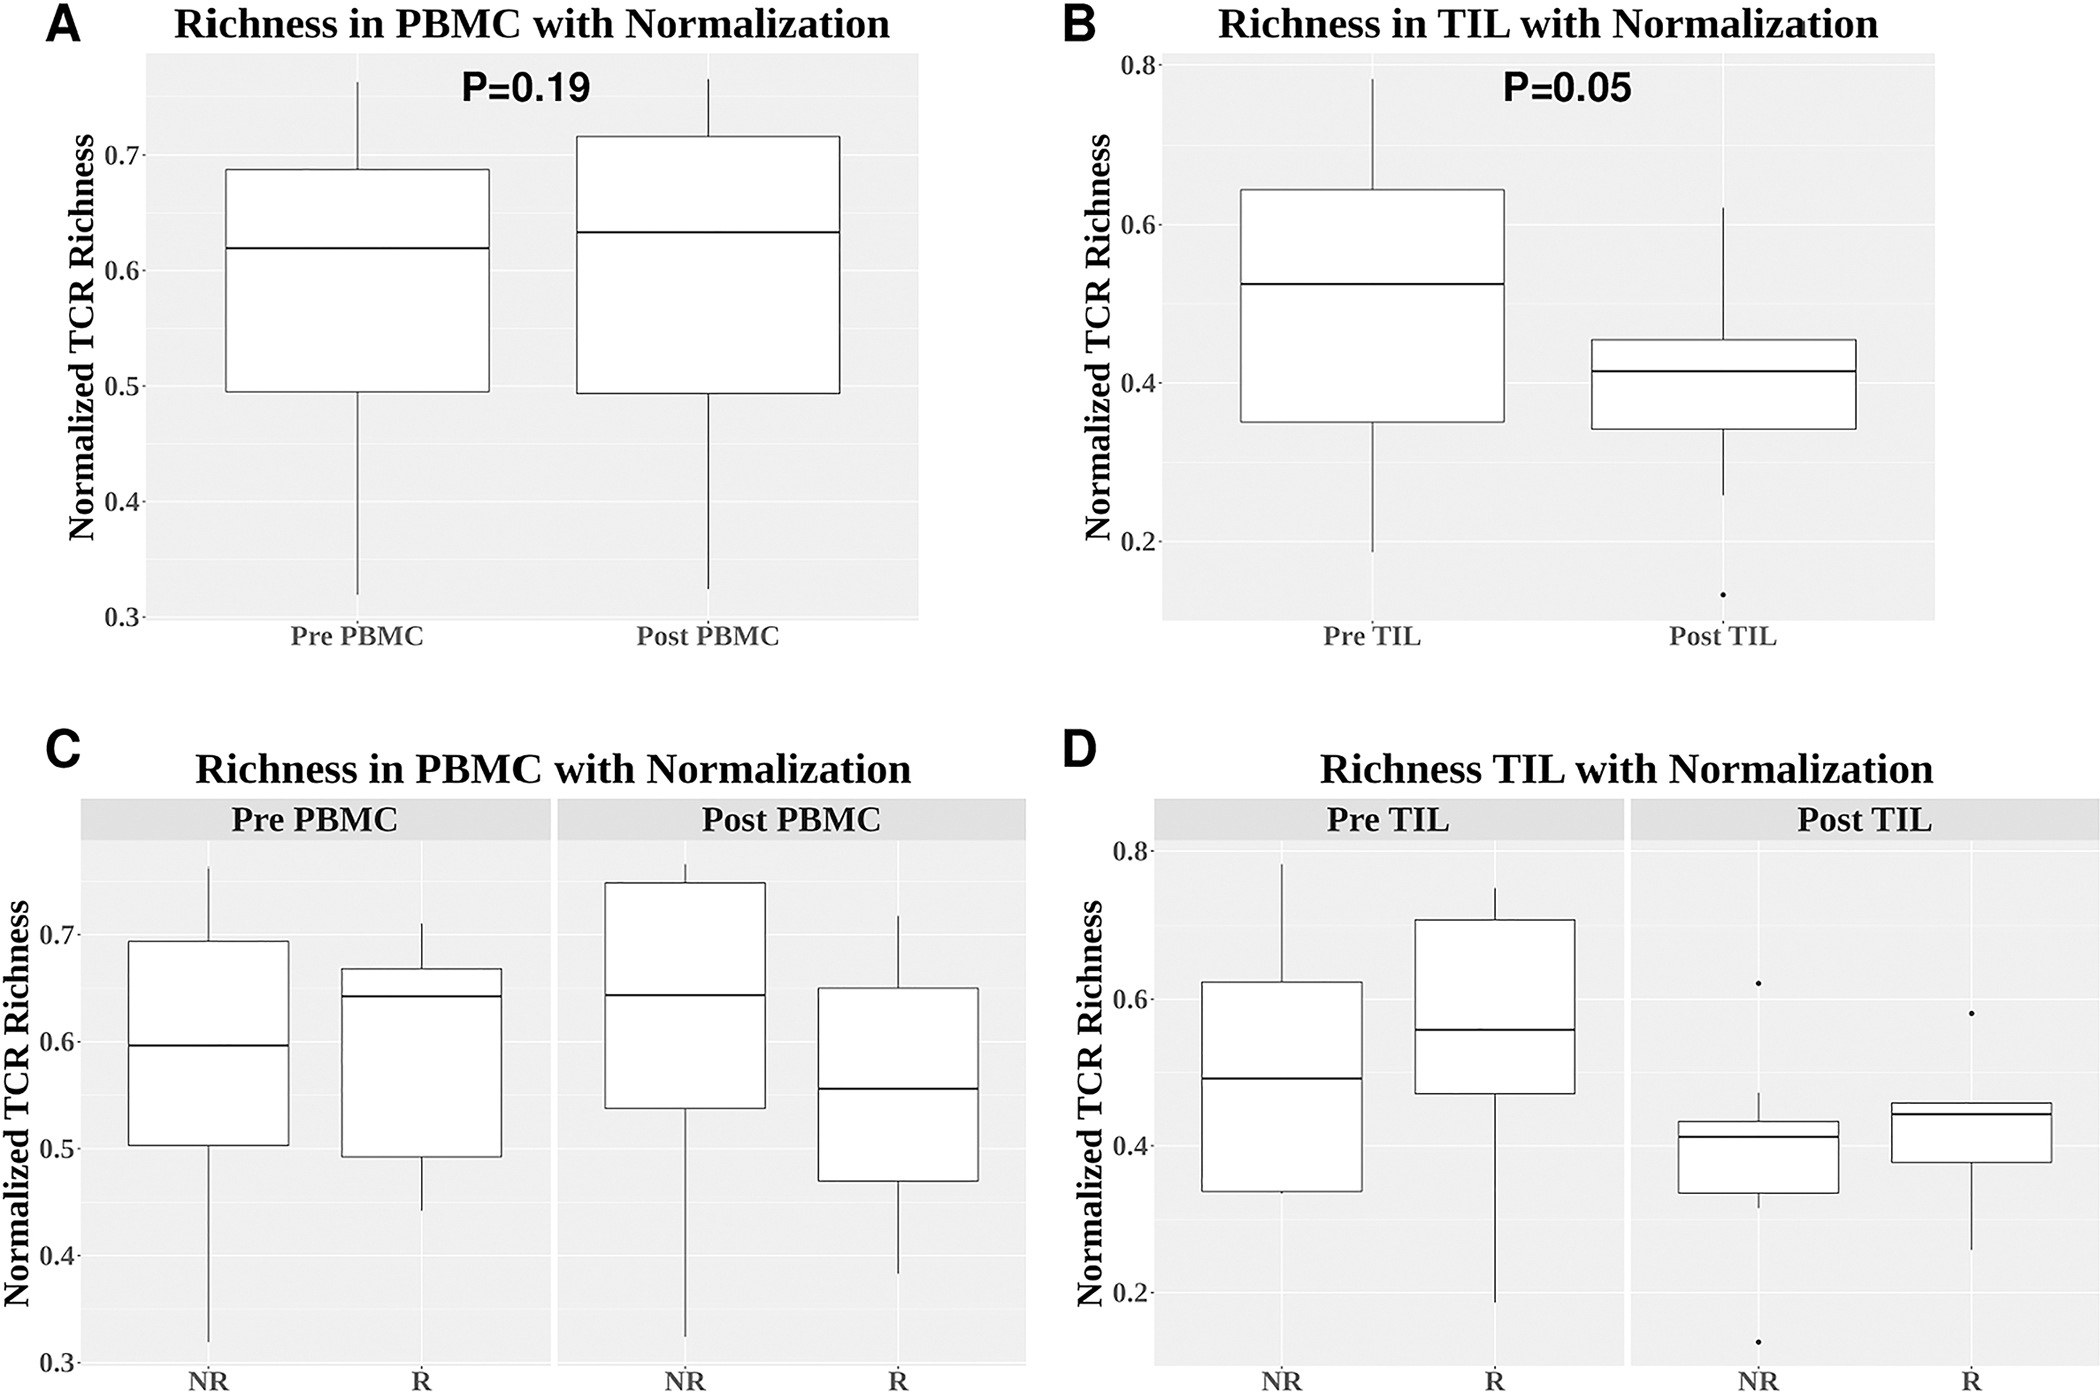
Figure 2. Comparison of normalized TCR richness.

(A-B) Comparison of normalized TCR richness between pre-PBMC and post-PBMC (p=0.19) (A) or between pre-TIL and post-TIL (p=0.05) (B). (C-D) Comparison of normalized TCR richness between responders and non-responders for pre-PBMC (p=1.0), post-PBMC (p=0.44), pre-TIL (p=0.80), and post-TIL (p=0.61). Differences between two independent groups were calculated by Wilcoxon signed rank test.
