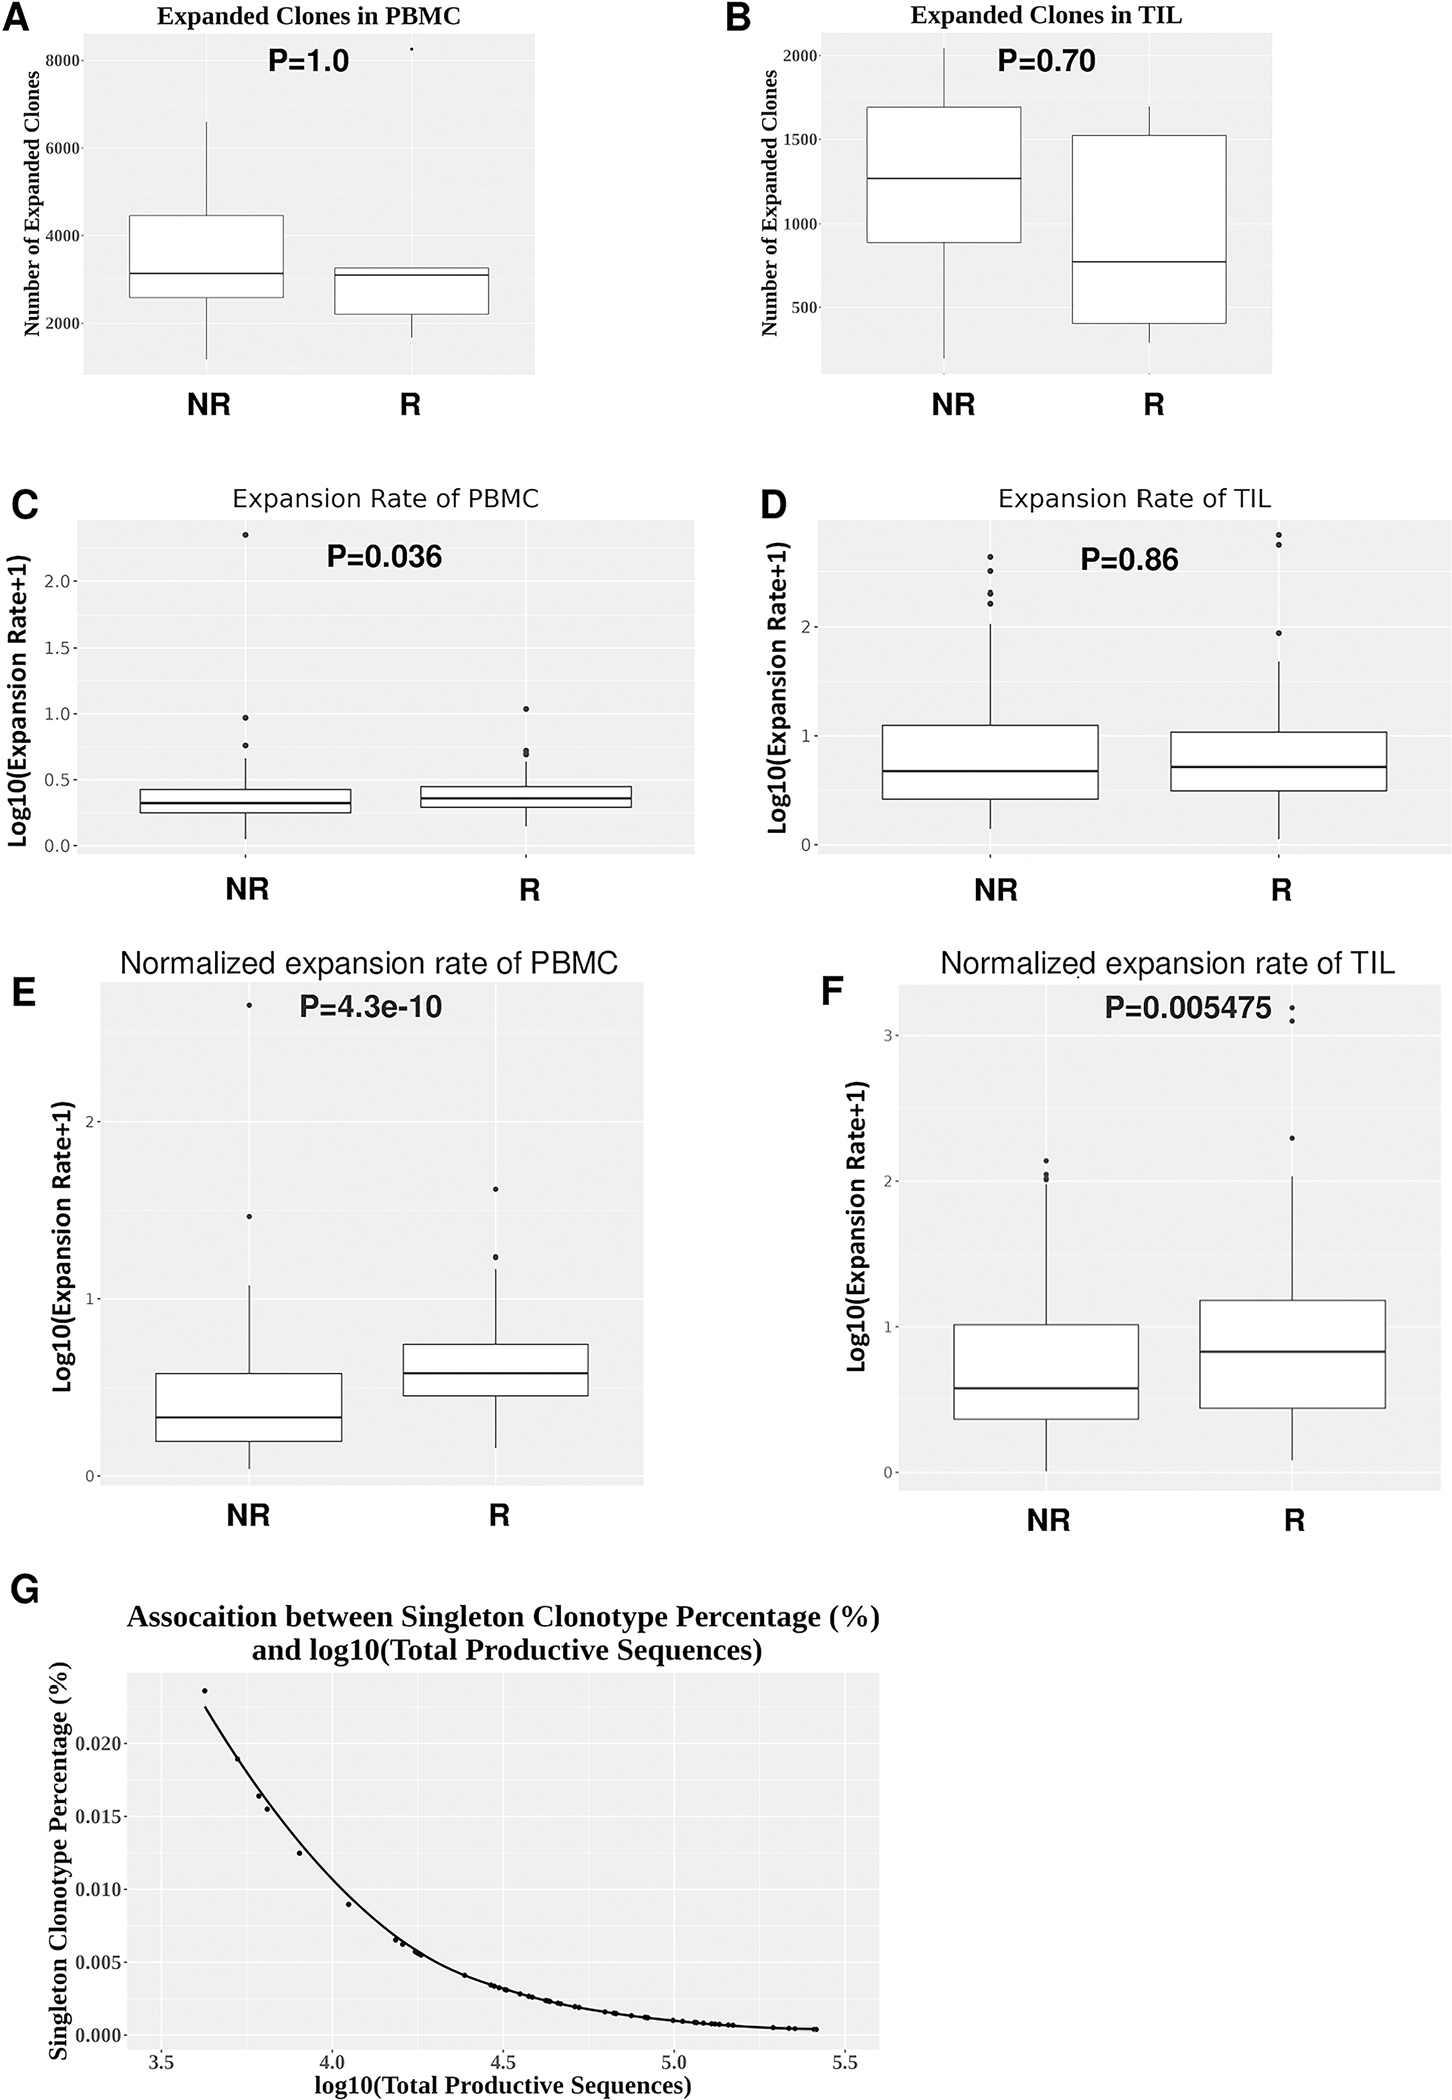
Figure 3. Differences in the expansion rate of top TCR clonotypes between responders and non-responders.

(A-B) Numbers of all expanded clones in PBMC or TIL between responders (n=5) and non-responder (n=9). Expanded clones were calculated by comparing the clonal frequency of a given TCR clone between pre-PBMC vs. post-PBMC or pre-TIL vs. post-TIL. (C-D) Comparison of expansion rate of expanded top 20 TCR clonotypes without normalization between responders (n=5) and non-responders (n=9) in PBMC (p=0.036) (C) or TIL (p=0.86) (D). (E-F) Comparison of expansion rate of expanded top 20 TCR clonotypes between responders (n=5) and non-responders (n=9) in PBMC (p=4.3e-10) (E) or TIL (p=0.005475) (F) normalized by the clonal frequency of a given singleton clonotype. Differences between two independent groups were calculated by Wilcoxon rank sum test. (G) An inverse correlation between the clonal frequency of singleton clonotype and Log10(total productive TCR sequences) (R2=0.73).
