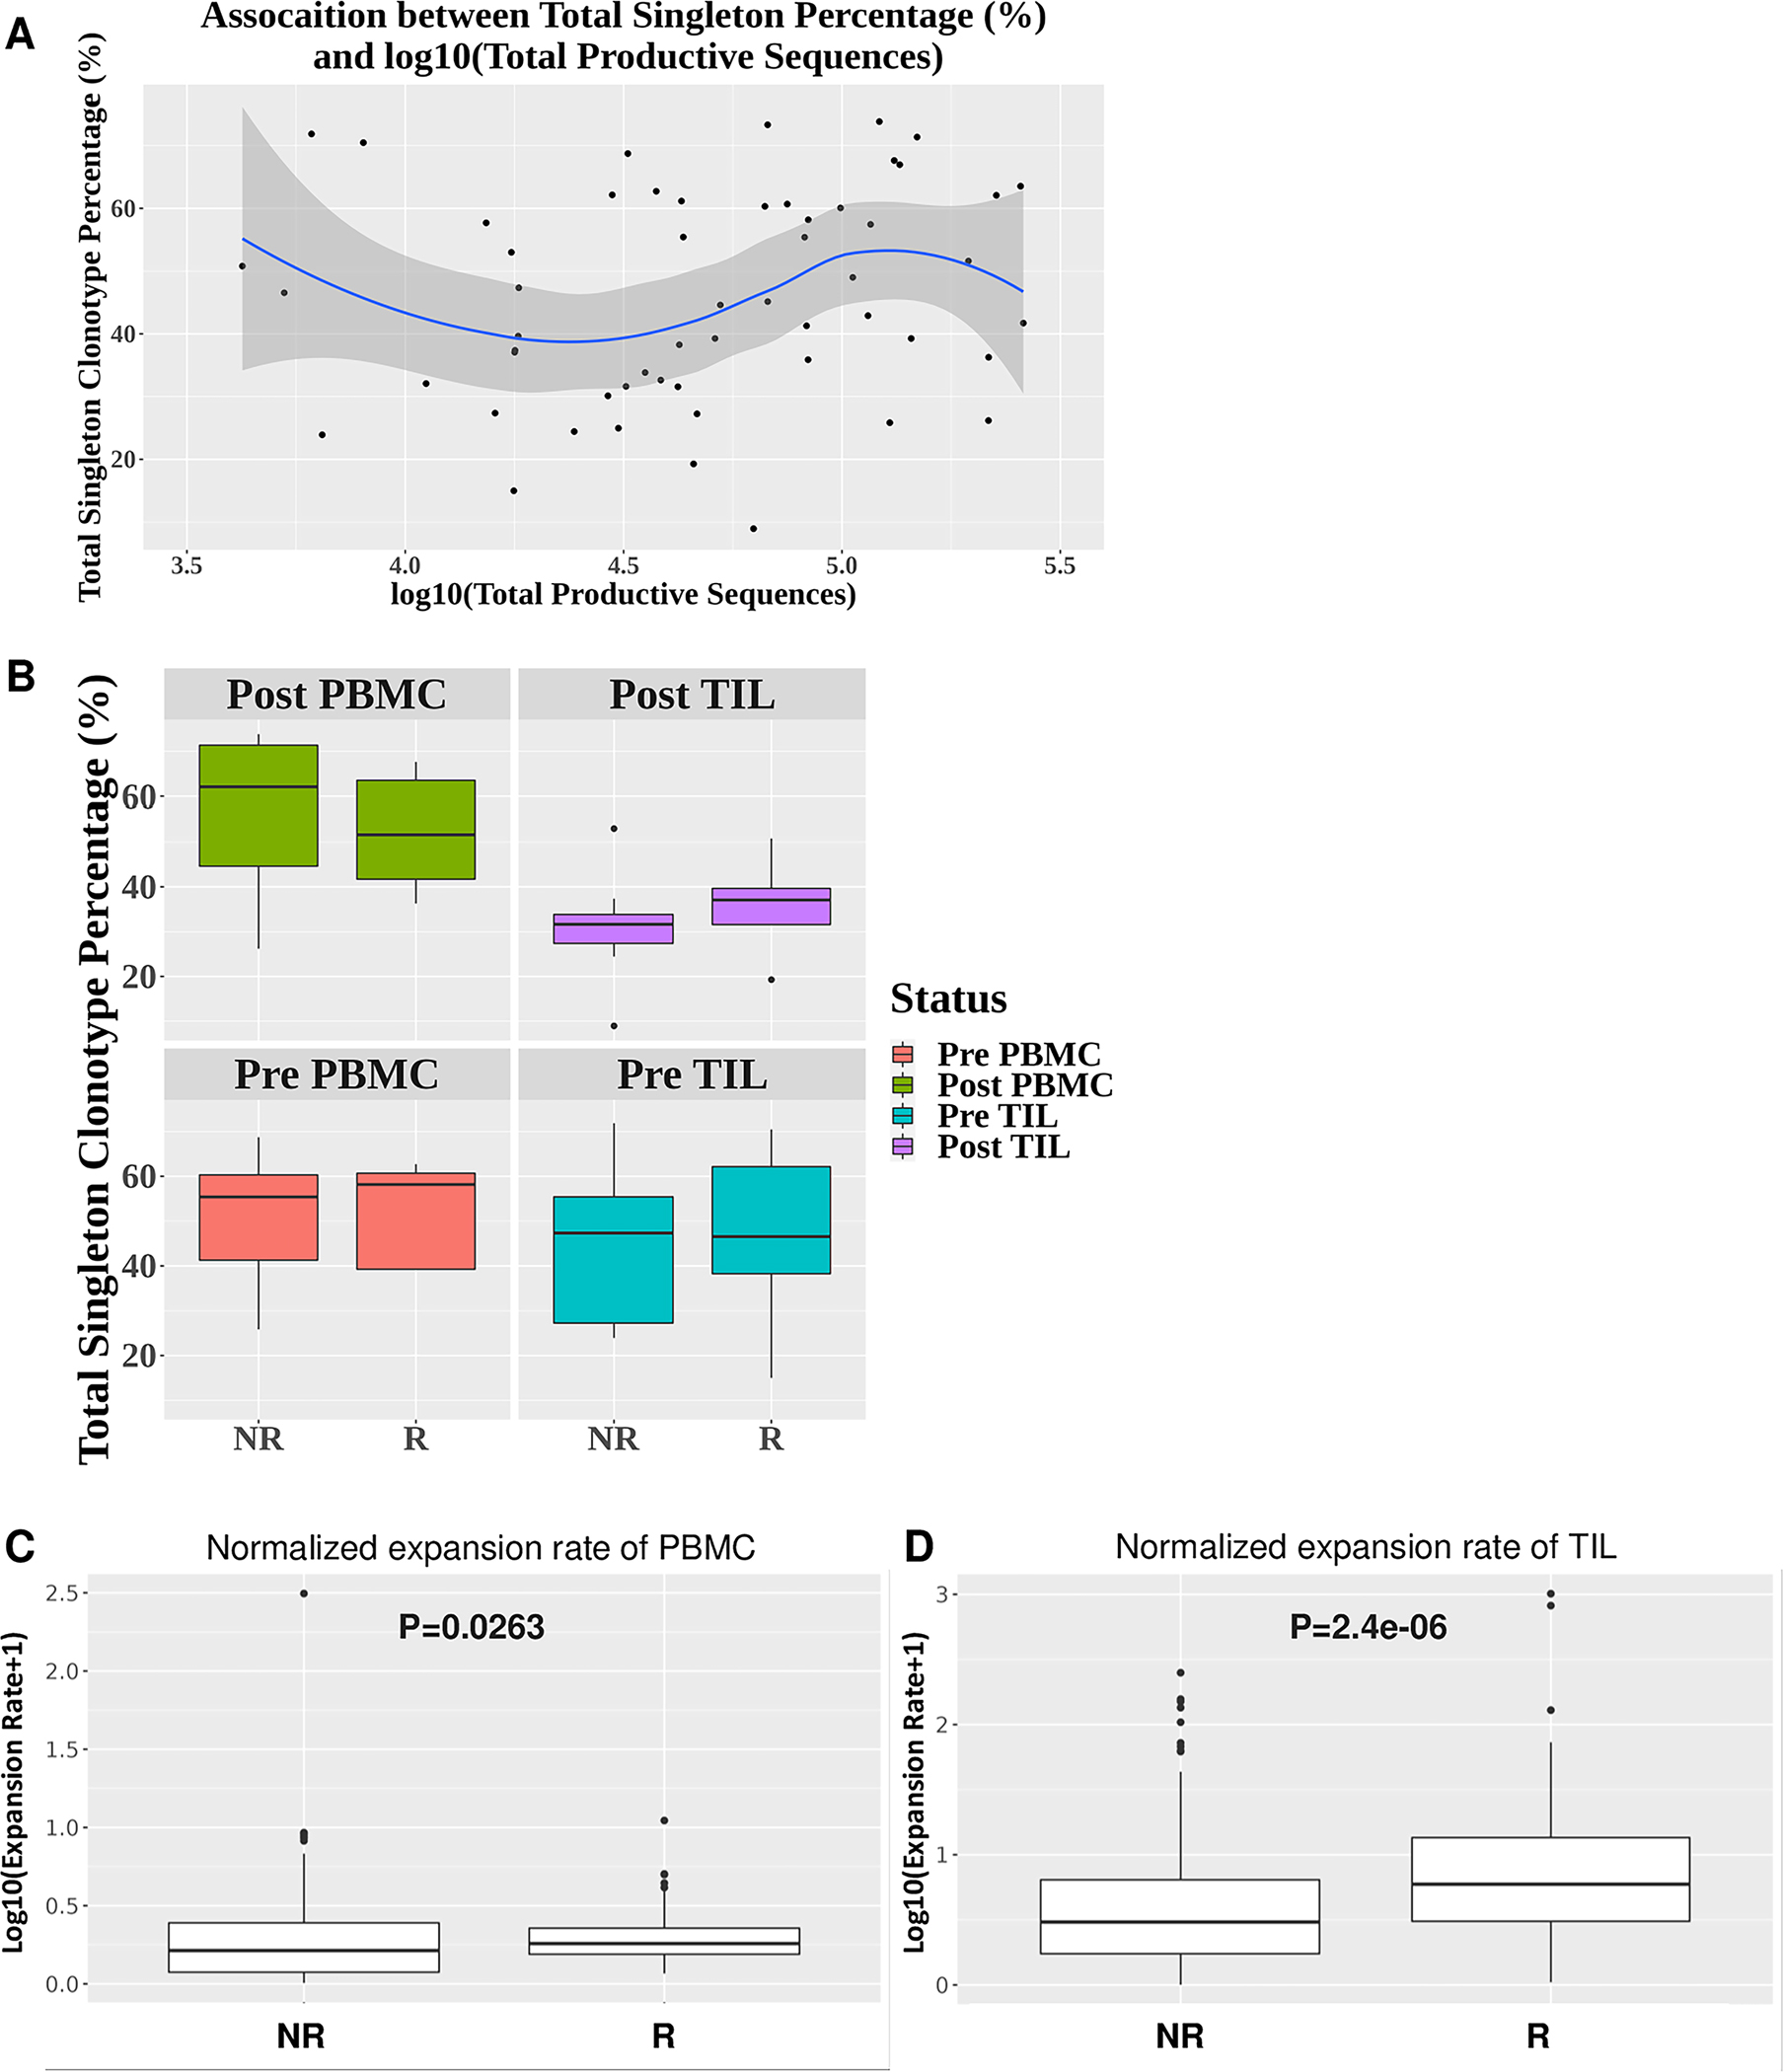
Figure 4. Differences in the normalized expansion rate of expanded top 20 TCR clonotypes between responder and non-responder TILs.

(A) Little association between the sum of frequency of singleton clonotypes and the number of total productive TCR sequences (n=56) (R2=0.035). (B) No significant differences in the sum of frequency of singleton clonotypes between responders (n=5) and non-responders (n=9) for post-PBMC (p=0.44), post-TIL (p=0.52), pre-PBMC (p=0.80), and pre-TIL (p=0.90). (C-D) Significant differences in the normalized expansion rate of expanded top 20 TCR clonotypes between responders (n=5) and non-responders (n=9) for PBMC (p=0.0263) or TIL (p=2.4e-06). Statistical difference was calculated by Wilcoxon rank sum test.
