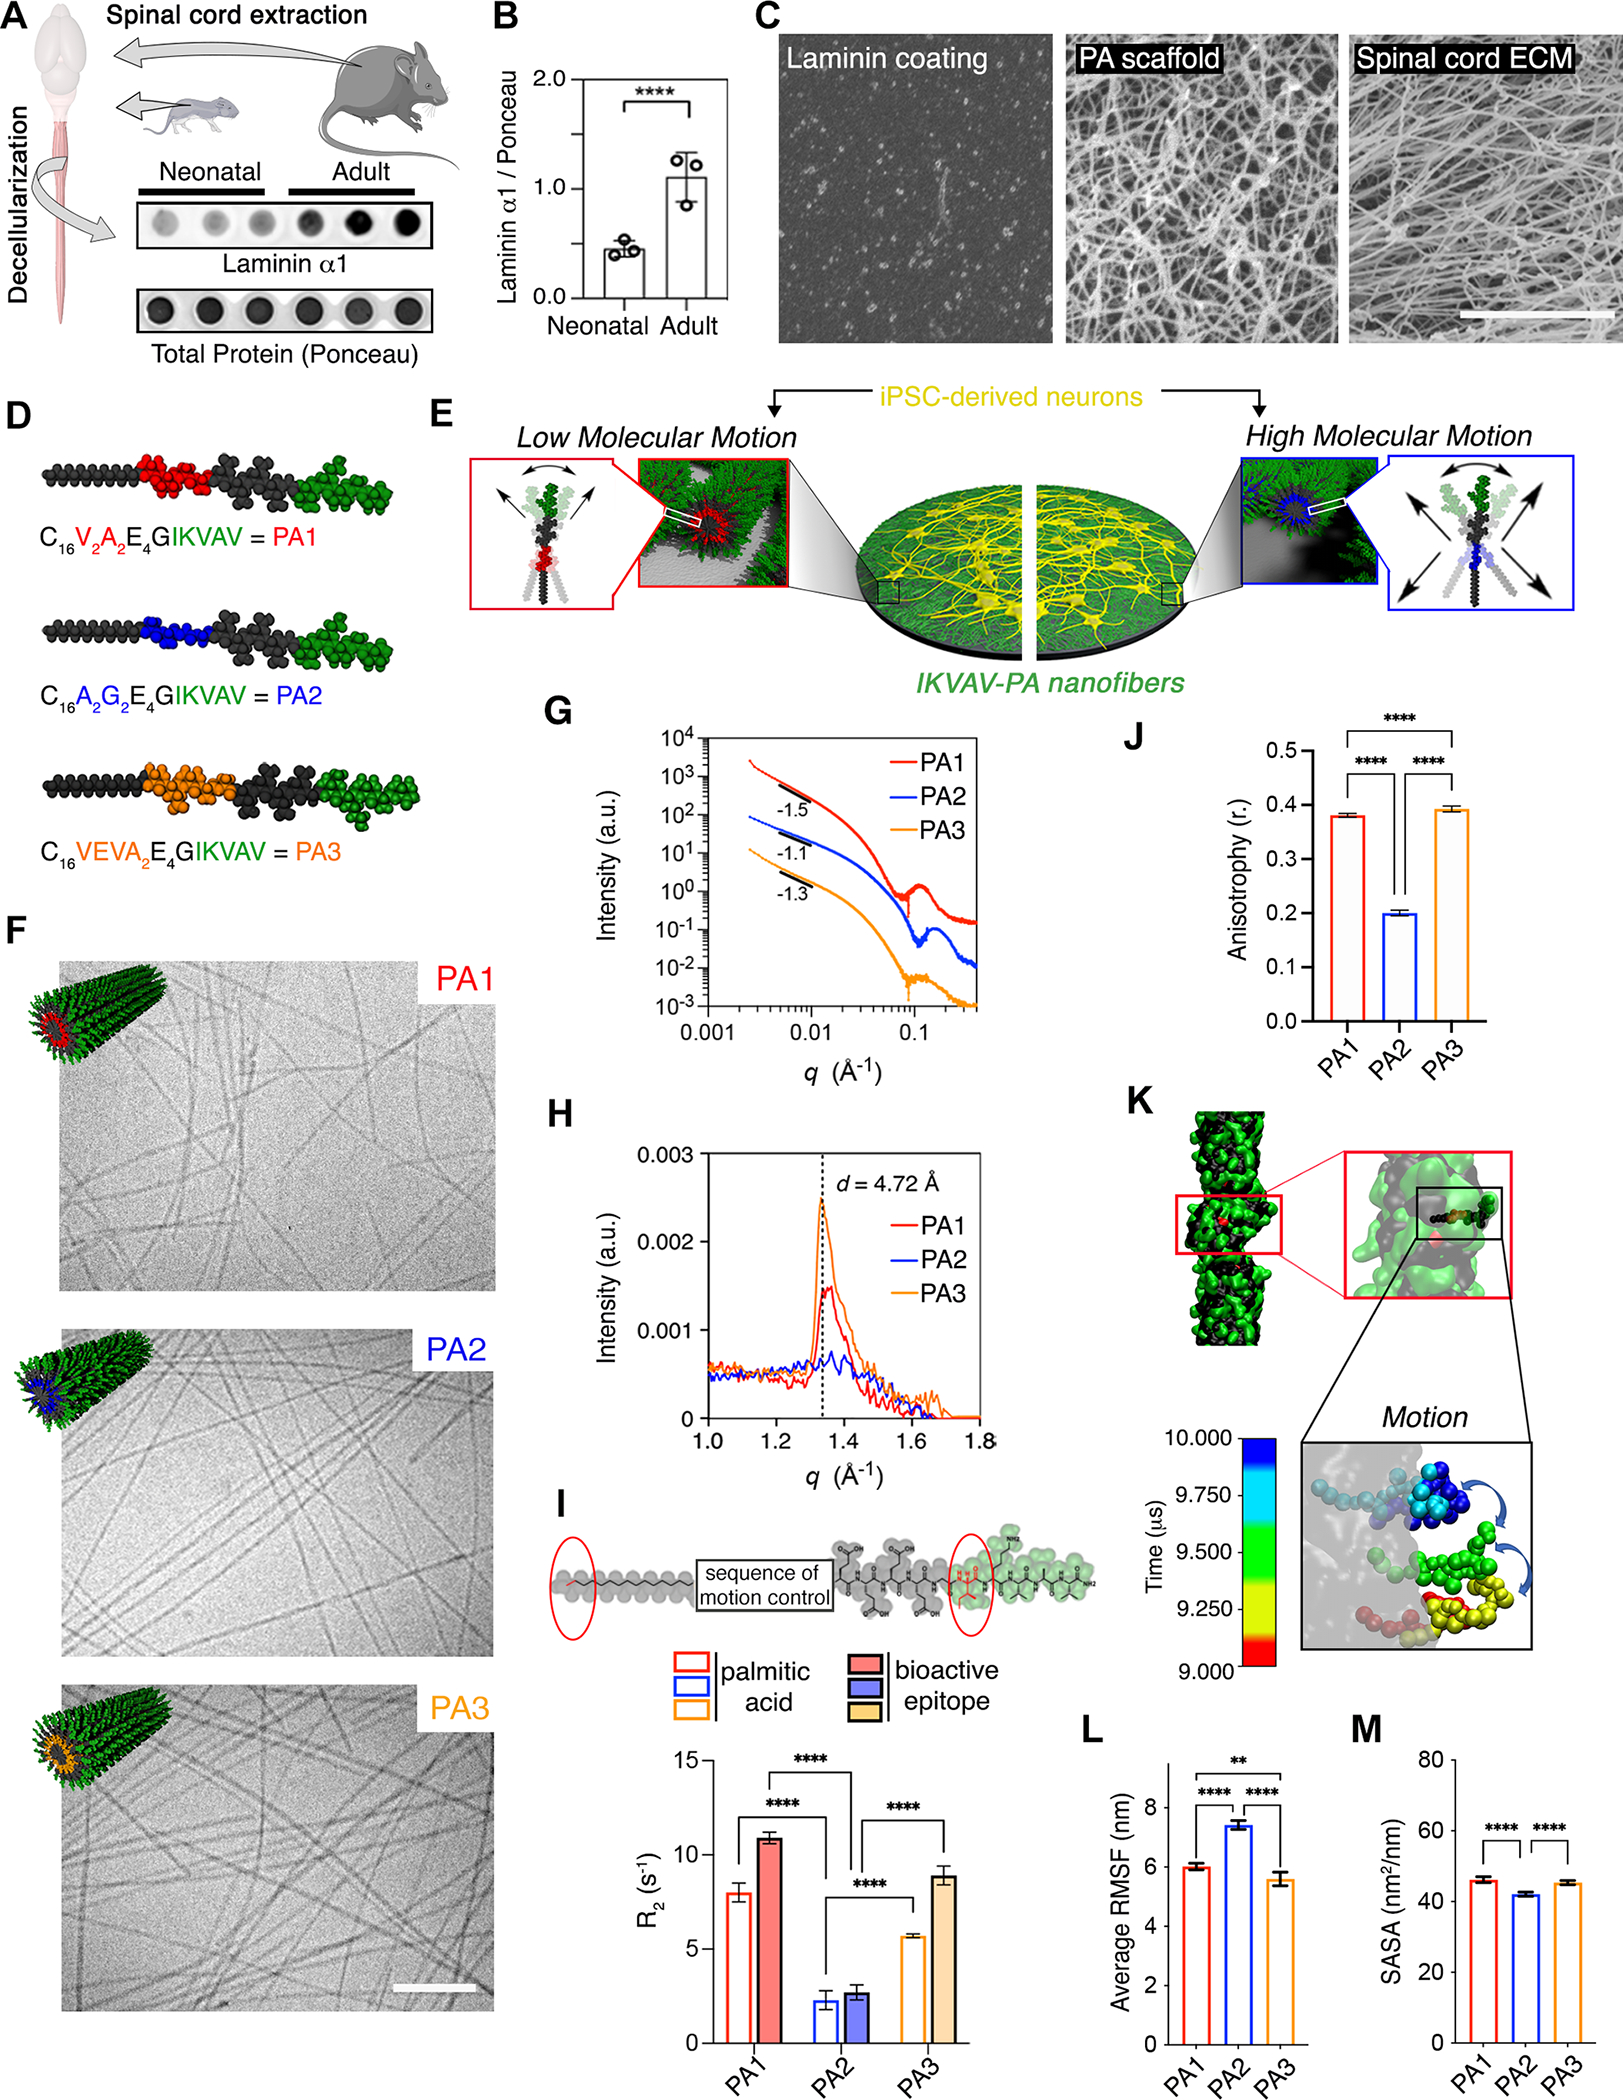
Figure 1. Characterization of IKVAV-PA Supramolecular Nanofibers with Different Degrees of Supramolecular Motion.

(A) Dot blot showing the protein level of laminin α1 in decellularized neonatal and adult mice spinal cords. Ponceau was used to assess total protein levels.
(B) Bar plot representing the normalized protein levels of laminin α1 in neonatal and adult mice spinal cords. Each dot represents values from independent biological replicates.
(C) SEM micrographs of laminin coating (left), PA scaffold (middle), and adult mouse decellularized spinal cord (right).
(D) Schematic representation of the chemical structure of each IKVAV-PA (V2A2= PA1, A2G2= PA2, and VEVA2= PA3).
(E) Schematic representation of hiPSC-derived neuron cultures on ECM-mimetic PA substrates with different degrees of molecular motion.
(F) Cryogenic TEM micrographs of PA1, PA2, and PA3 along with the molecular graphic representation (top, left) of each of the supramolecular fibers displaying IKVAV in green.
(G) Line graph showing the SAXS patterns of PA1, PA2, and PA3 nanofibers.
(H) Line graph showing the WAXS profiles of PA1, PA2, and PA3 nanofibers.
(I) Top: Chemical structure of IKVAV-PA sequence highlighting the first C in the aliphatic tail and I in the bioactive sequence analyzed by T2-NMR. Bottom: Bar graph showing the relaxation time for PA1, PA2 and PA3 molecules.
(J) Bar graph showing the fluorescence anisotropy (λex = 336 nm, λem = 450 nm) of PA1, PA2, and PA3 embedded 1–6-phenyl-1,3,5-hexatriene p-toluenesulfonate (DPH).
(K) Self-assembled structure of a single IKVAV-PA fiber after 10 μs of coarse-grained molecular dynamic simulation. Inset: Motion of a single peptide within the fiber during the last 1 F06Ds after equilibrating the structure. The illustrations include partial periodic images through the fiber formation axis. Water and ions are omitted for clarity.
(L) Bar graph showing the average of root-mean-square fluctuation (RMSF) values for the different IKVAV-PAs during the last 5 μs after equilibrating the fiber structures.
(M) Bar graph showing the SASA values of the IKVAV epitope displayed on the different IKVAV-PAs fibers in the equilibrated structure.
Scale bars: C=5 μm, F=250 nm. All the values are presented as the mean ± SD.
