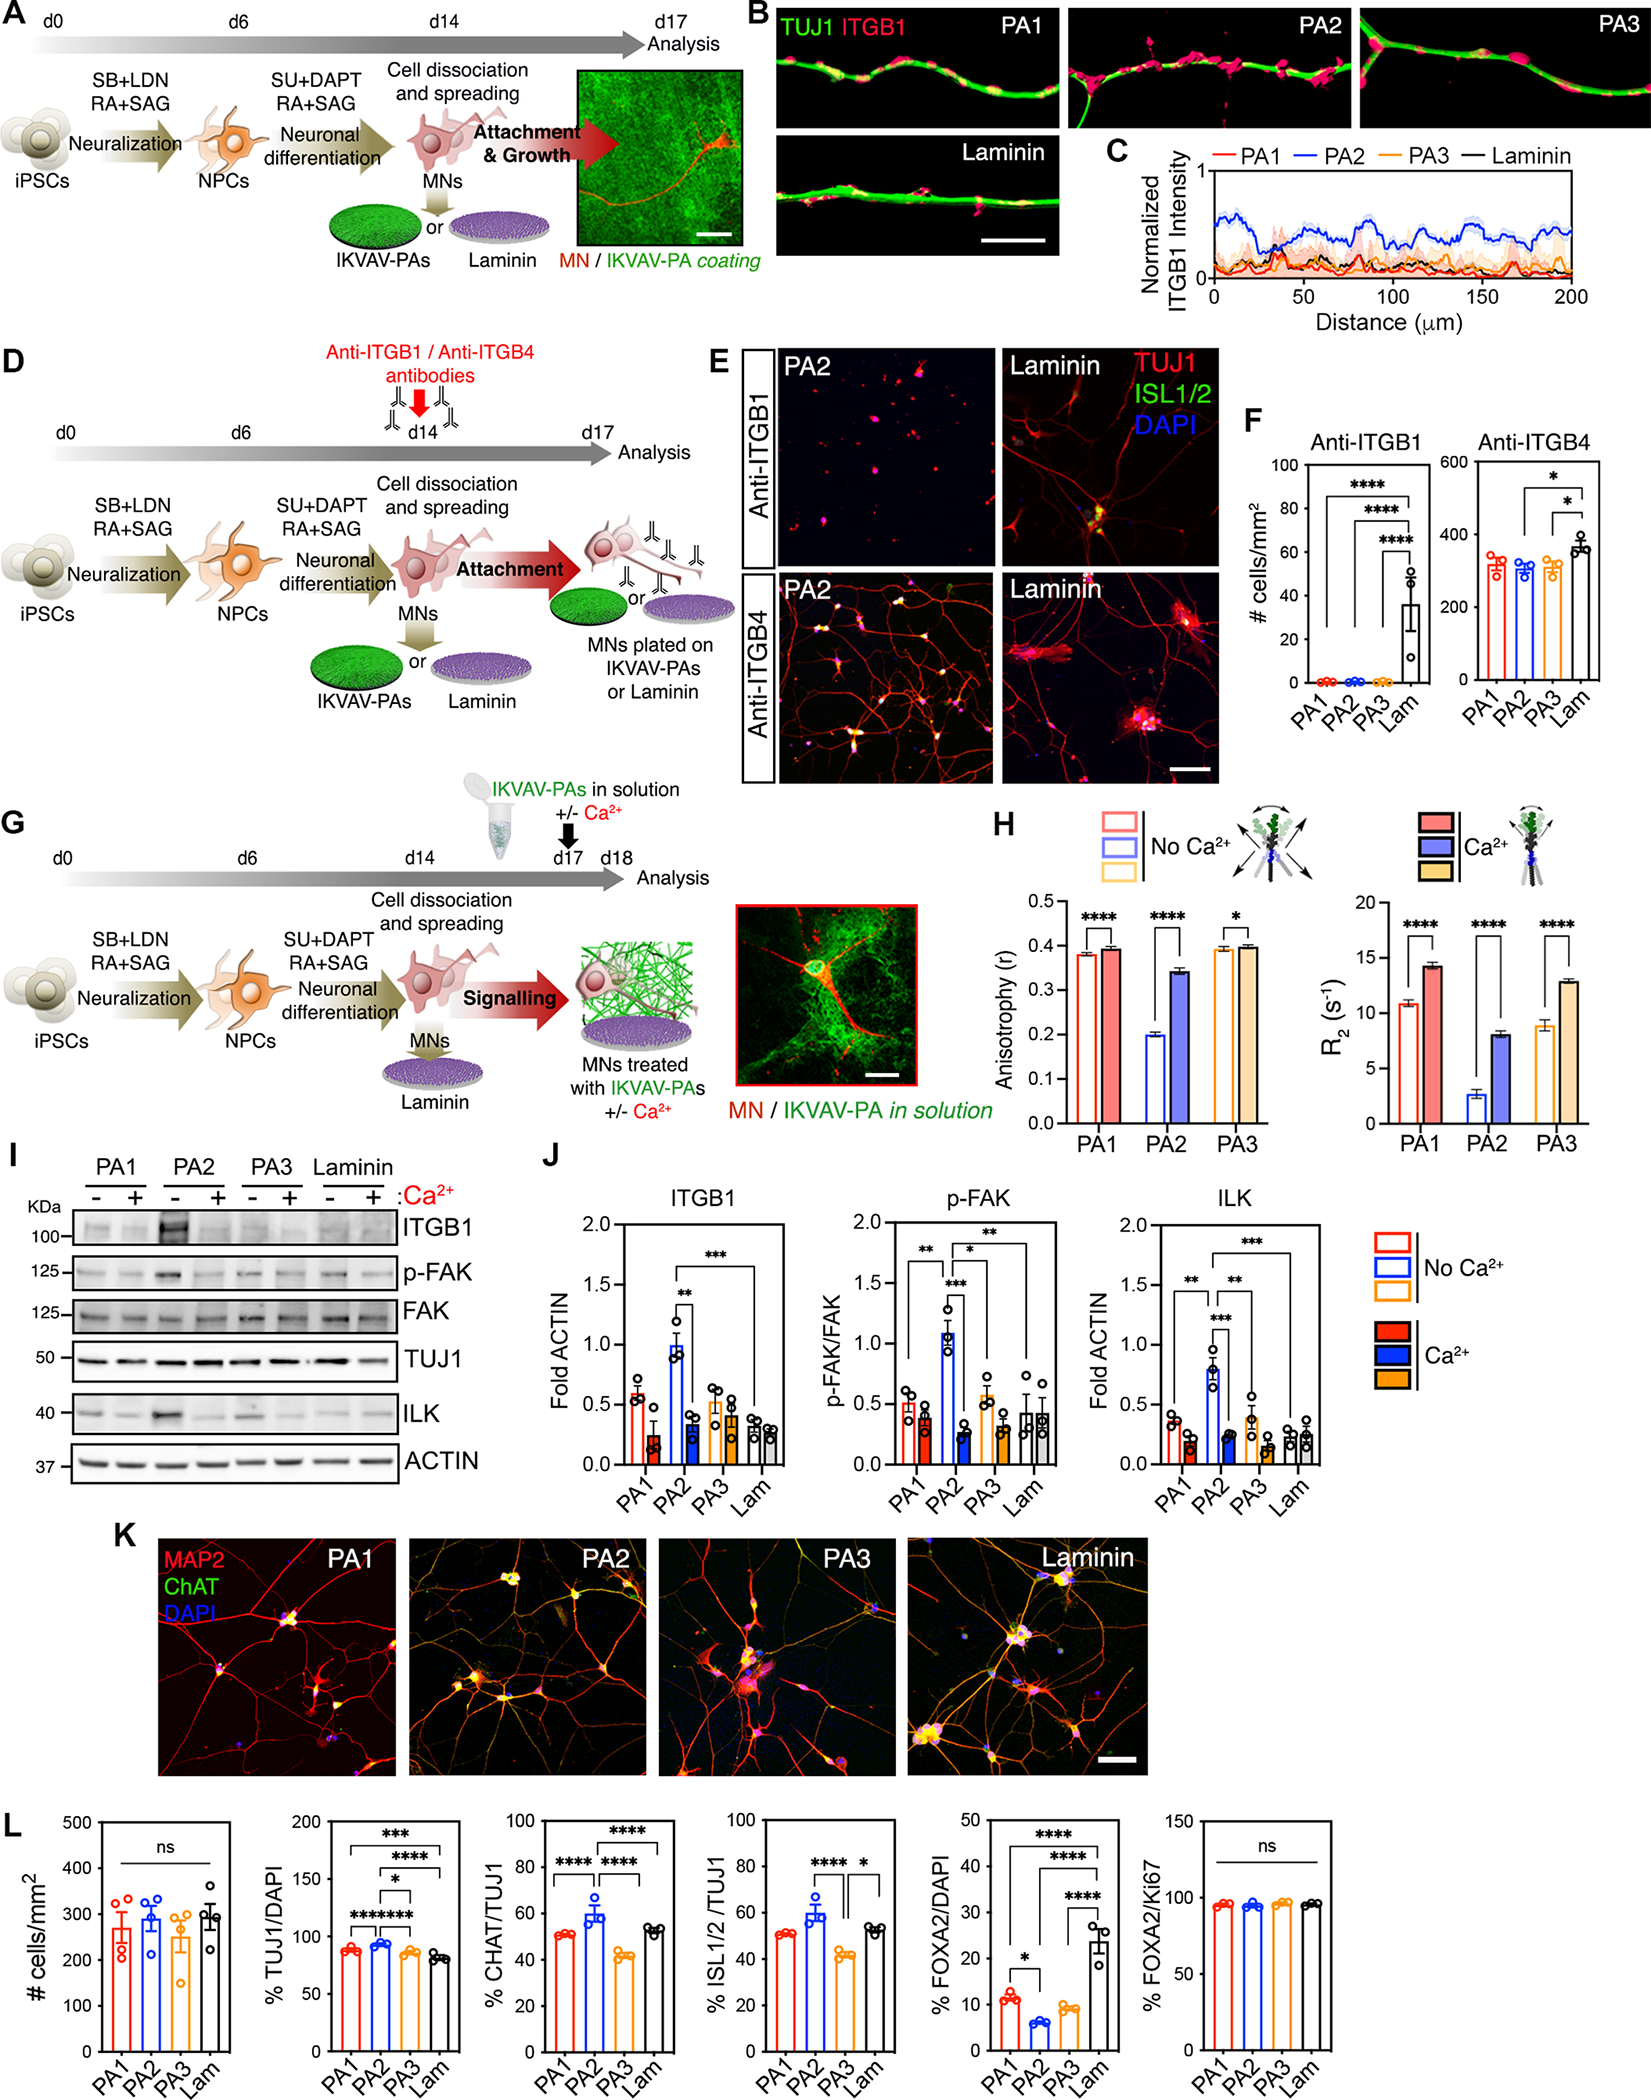
Figure 2. Highly Mobile IKVAV-PA Supramolecular Scaffold Enhances Integrin-Dependent Effects on hiPSC-Derived MNs.

(A) Schematic representation of the experimental workflow for short-term culture experiments with hiPSC-derived MNs on IKVAV-PA scaffolds or laminin. Right: structured illumination microscopy micrograph of an hiPSC-derived MN labeled with TUJ1 (red) after 72h cultured on PA2 covalently linked to alexa-488 dye (green).
(B) Representative 3D SIM shadow reconstructions of neurites of MNs cultured on IKVAV-PAs or laminin, immunolabeled for TUJ1 (green) and ITGB1 (pink).
(C) Line graph showing intensity analysis of ITGB1 labeling on neurites of MNs cultured on IKVAV-PAs orlaminin for 72 h.
(D) Schematic representation of the experimental workflow for short-term experiments with hiPSC-derived MNs cultured on IKVAV-PA scaffolds or laminin and treated with anti-ITGB1 or anti-ITGB4 antibodies.
(E) Representative confocal micrographs of MNs cultured on different IKVAV-PA fibers or laminin and treated with anti-ITGB1- or anti-ITGB4-blocking antibodies for 72 h. Cells were stained with neuronal (TUJ1, red) and MN (ISL1/2, green) markers, and nuclei were stained with DAPI (blue).
(F) Bar graphs representing the number of cells per mm2 on hiPSC-derived MN cultures after 72 h on IKVAV-PAs or laminin and treated with anti-ITGB1 or anti-ITGB4 antibodies.
(G) Schematic representation of the experimental workflow of hiPSC-derived MNs cultured on laminin coatings and IKVAV-PAs in solution with or without calcium treatment. Right: Confocal microscopy micrograph of a MN labeled with MAP2 (red) after 24 h treatment with alexa-488-labeled PA2 (green) in solution.
(H) Left: Bar graph showing fluorescence anisotropy of PA1, PA2, and PA3 with DPH in the presence or absence of calcium. Error bars represent to 3 independent experiments. Right: Bar graph of Isoleucine (I) relaxation time of the IKVAV-PAs in the presence or absence of calcium. Error bars correspond to 3 independent runs per condition.
(I) Representative WB of ITGB1 and downstream kinases of the integrin-transduction pathway (ILK, p-FAK, FAK) in MNs treated with IKVAV-PAs in the presence or absence of calcium for 72 h. TUJ1 was used to assess the neuronal-specific protein levels across conditions and ACTIN as a loading control. Laminin condition refers to MN cultures on laminin coating and non-treated with PAs in solution.
(J) Bar graphs representing the normalized protein levels of ITGB1, p-FAK, and ILK in MN cultures with IKVAV-PAs in solution with or without calcium treatment for 72 h.
(K) Representative confocal micrographs of hiPSC-derived MN cultures on IKVAV-PAs and laminin coatings stained for neuronal (MAP2, red) and MN (ChAT, green) markers. Nuclei stained with DAPI (blue).
(L) Bar graphs representing the number of cells per mm2, the percentage of TUJ1/DAPI, ChAT/TUJ1, ISL1/2/TUJ1, FOXA2/DAPI and FOXA2/Ki67 labeled cells in hiPSC-derived MN cultures on IKVAV-PAs and laminin coatings at 72 h.
Data was obtained from at least 3 independent differentiations. All values are presented as the mean ± SEM except for (J) where the values are presented as the mean ± SD. Each dot in graphs represents average values of multiple fields from a specific differentiation. Scale bars: A= 20 μm, B= 10 μm, E and K=100 μm, G= 25 μm.
