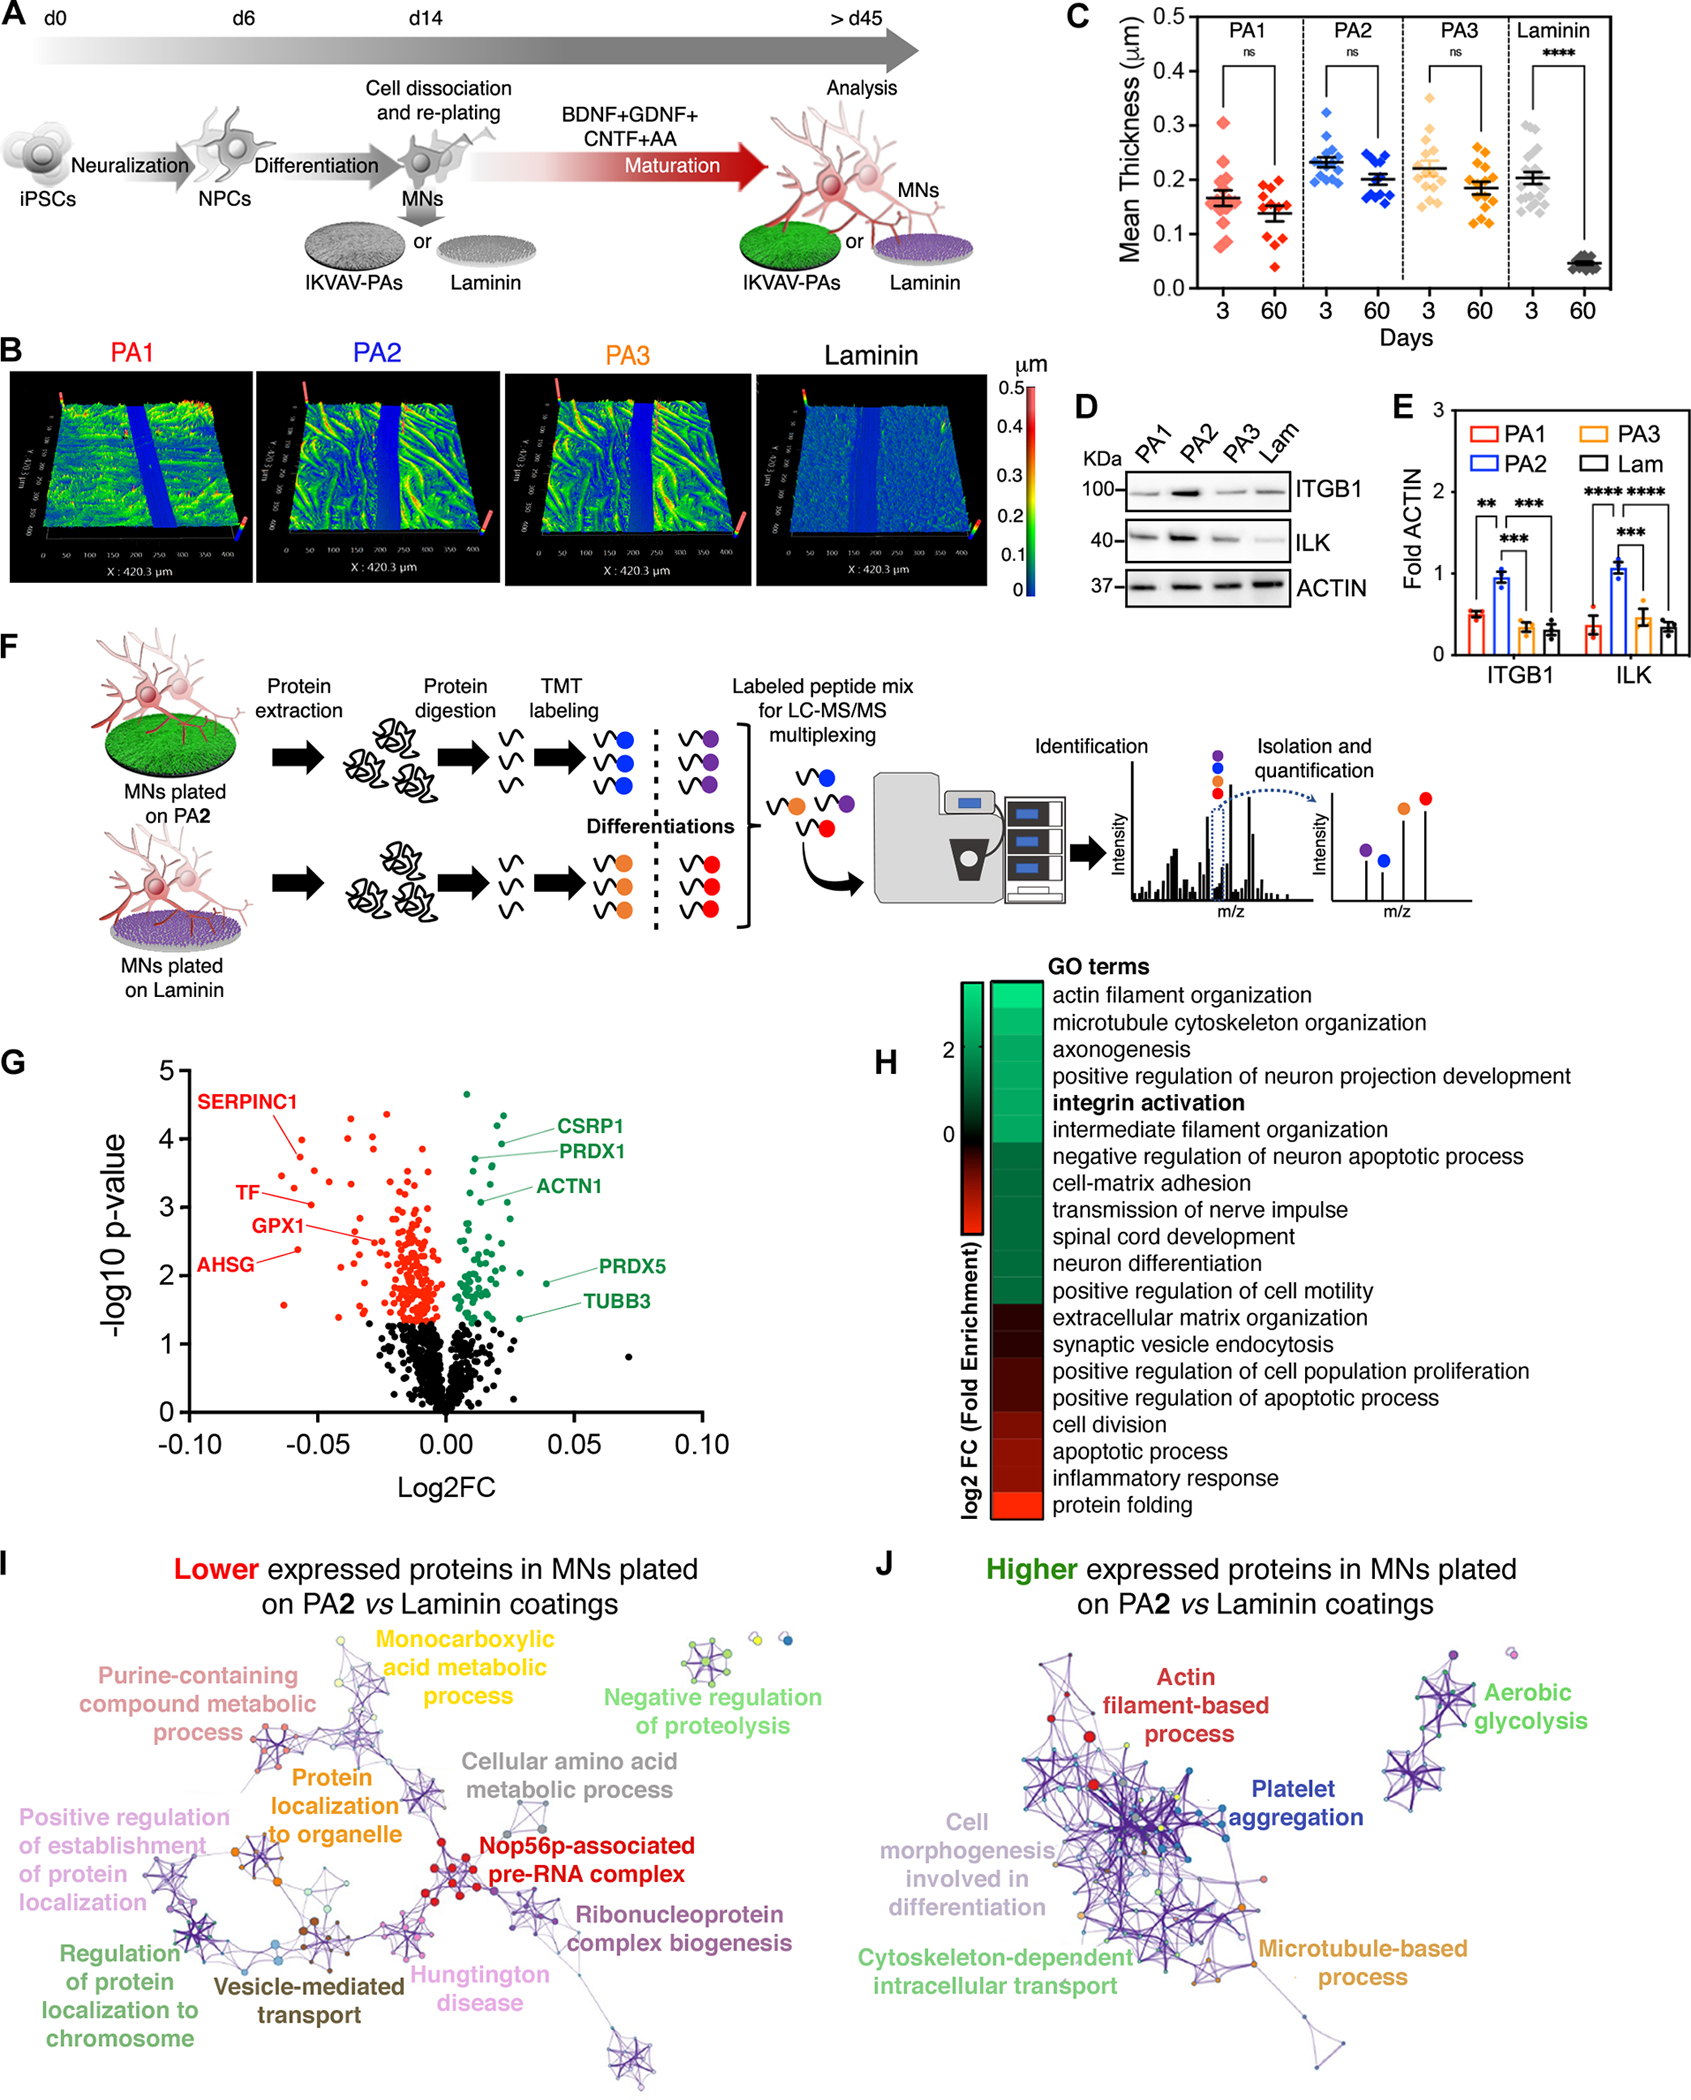
Figure 3. Unbiased Characterization of the Effects of IKVAV-PA Nanofibers with High Supramolecular Motion on Long-Term hiPSC-Derived MN Cultures.

(A) Schematic representation of the experimental workflow for long-term culture experiments with hiPSC-derived MNs on IKVAV-PA scaffolds or laminin.
(B) Profilometry images of IKVAV-PAs and laminin coatings after 60 days in vitro.
(C) Dot plot representing the thickness of the different IKVAV-PA and laminin coatings after 3 and 60 days in vitro. Each dot represents values from independent coverslips.
(D) Representative WB of ITGB1 and ILK in MNs cultured on the different IKVAV-PAs or laminin for 45 days. ACTIN was used as a loading control.
(E) Bar graphs representing the normalized protein levels of ITGB and ILK in MNs cultured on different IKVAV-PAs or laminin for 45 days. Each dot represents the values from independent differentiations.
(F) Schematic representation of the quantitative proteomic analysis carried out in MNs cultured on PA2 or laminin for 45 days.
(G) Volcano plot displaying proteomic changes in hiPSC-derived MNs cultured on PA2 vs. laminin. Averages of log2 fold change (x-axis) vs. −log10 P-value (y-axis) values of each protein are represented by individual dots. Proteins up- and down-regulated by 2-fold and FDR < 0.05 are labeled with green and red dots, respectively.
(H) Subset of the most significant comparative GO terms enriched in the up-regulated (green) and down-regulated (red) group of proteins identified in hiPSC-derived MNs cultured on PA2 vs. laminin.
(I) Cytoscape pathway enrichment analysis of down-regulated proteins in hiPSC-derived MNs cultured on PA2 vs. laminin.
(J) Cytoscape pathway enrichment analysis of up-regulated proteins in hiPSC-derived MNs cultured on PA2 vs. laminin.
