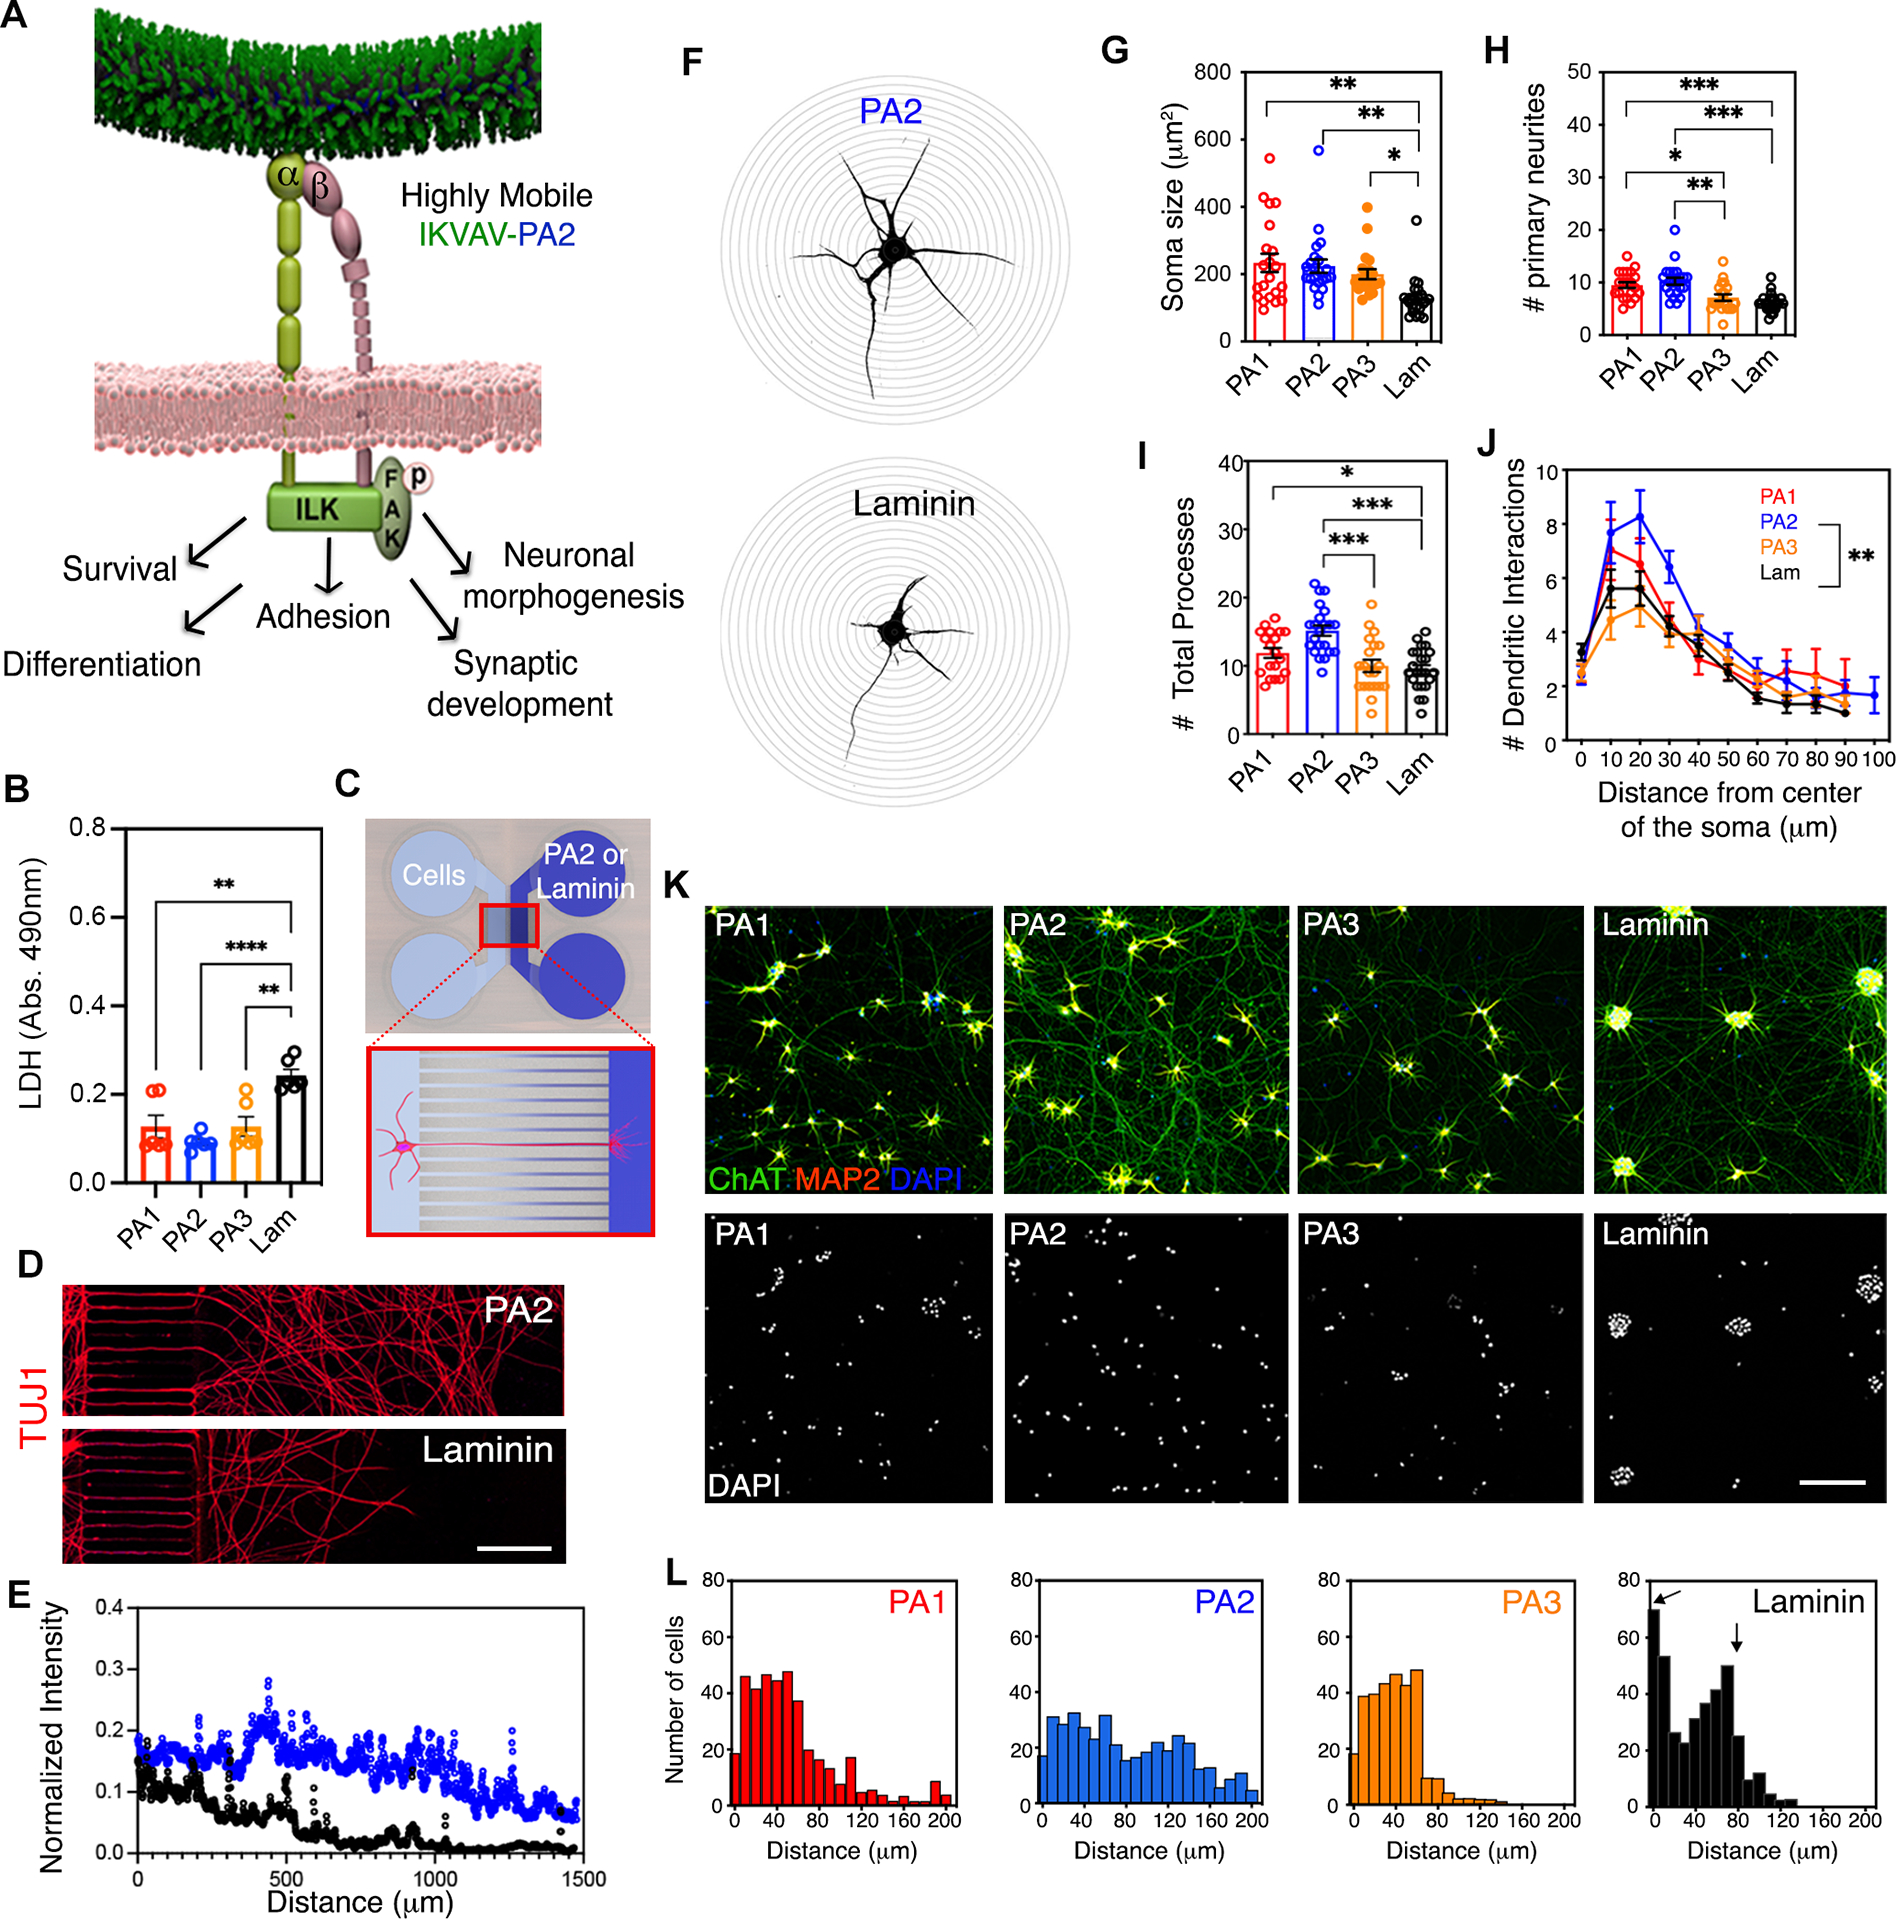
Figure 4. The Effect of IKVAV-PA Nanofibers with High Supramolecular Motion on Long-Term Survival, Adhesion and Neuronal Morphogenesis on hiPSC-Derived MN Cultures.

(A) Schematic representation of integrin signal transduction pathways that might mediate cellular behavior changes upon highly mobile presentation of IKVAV by the PA2.
(B) Bar graph representing LDH levels in hiPSC-derived MN cultures after 45 days on PA1, PA2, PA3 and laminin.
(C) Schematic representation of a microfluidic device system utilized to measure axonal growth on PA2 and laminin.
(D) Representative confocal micrographs of hiPSC-derived MN neurites along microchannels treated with PA2 or laminin after 30 days in culture. Neuronal processes were stained with TUJ1.
(E) Line graph displaying the fluorescence intensities of TUJ1+ neurite staining in hiPSC-derived MN cultures grown in microfluidic devices treated with PA2 or commercial laminin.
(F) Representative confocal micrographs of hiPSC-derived MNs on PA2 (top) or laminin (bottom) used for Sholl analysis.
(G) Bar graph depicting the soma size in hiPSC-derived MNs cultured on IKVAV-PAs or laminin for >45 days.
(H) Bar graph depicting the number of primary neurites in hiPSC-derived MNs cultured on IKVAV-PAs or laminin for >45 days.
(I) Bar graph depicting the number of total neurite processes in hiPSC-derived MNs cultured on IKVAV-PAs or laminin for >45 days.
(J) Line graph depicting Sholl analysis of dendritic arborization of MNs cultured on the various coatings for >45 days in vitro.
(K) Representative confocal micrographs of hiPSC-derived MN cultures plated on IKVAV-PAs or laminin for >45 days. Cells were stained with neuronal (MAP2, red) and MN (ChAT, green) markers (top row). Nuclei were stained with DAPI (bottom row).
(L) Histogram analysis of cell distribution on the different coatings referred on K.
Data was obtained from at least 3 independent differentiations. All values are presented as the mean ± SEM; Each dot in graphs represents average values of multiple fields from a specific differentiation in B and individual cells in G-I. Scale bars: D=25 μm and E=100 μm.
