
Figure 2. RB1 mutation and expression in SCLC cell lines.
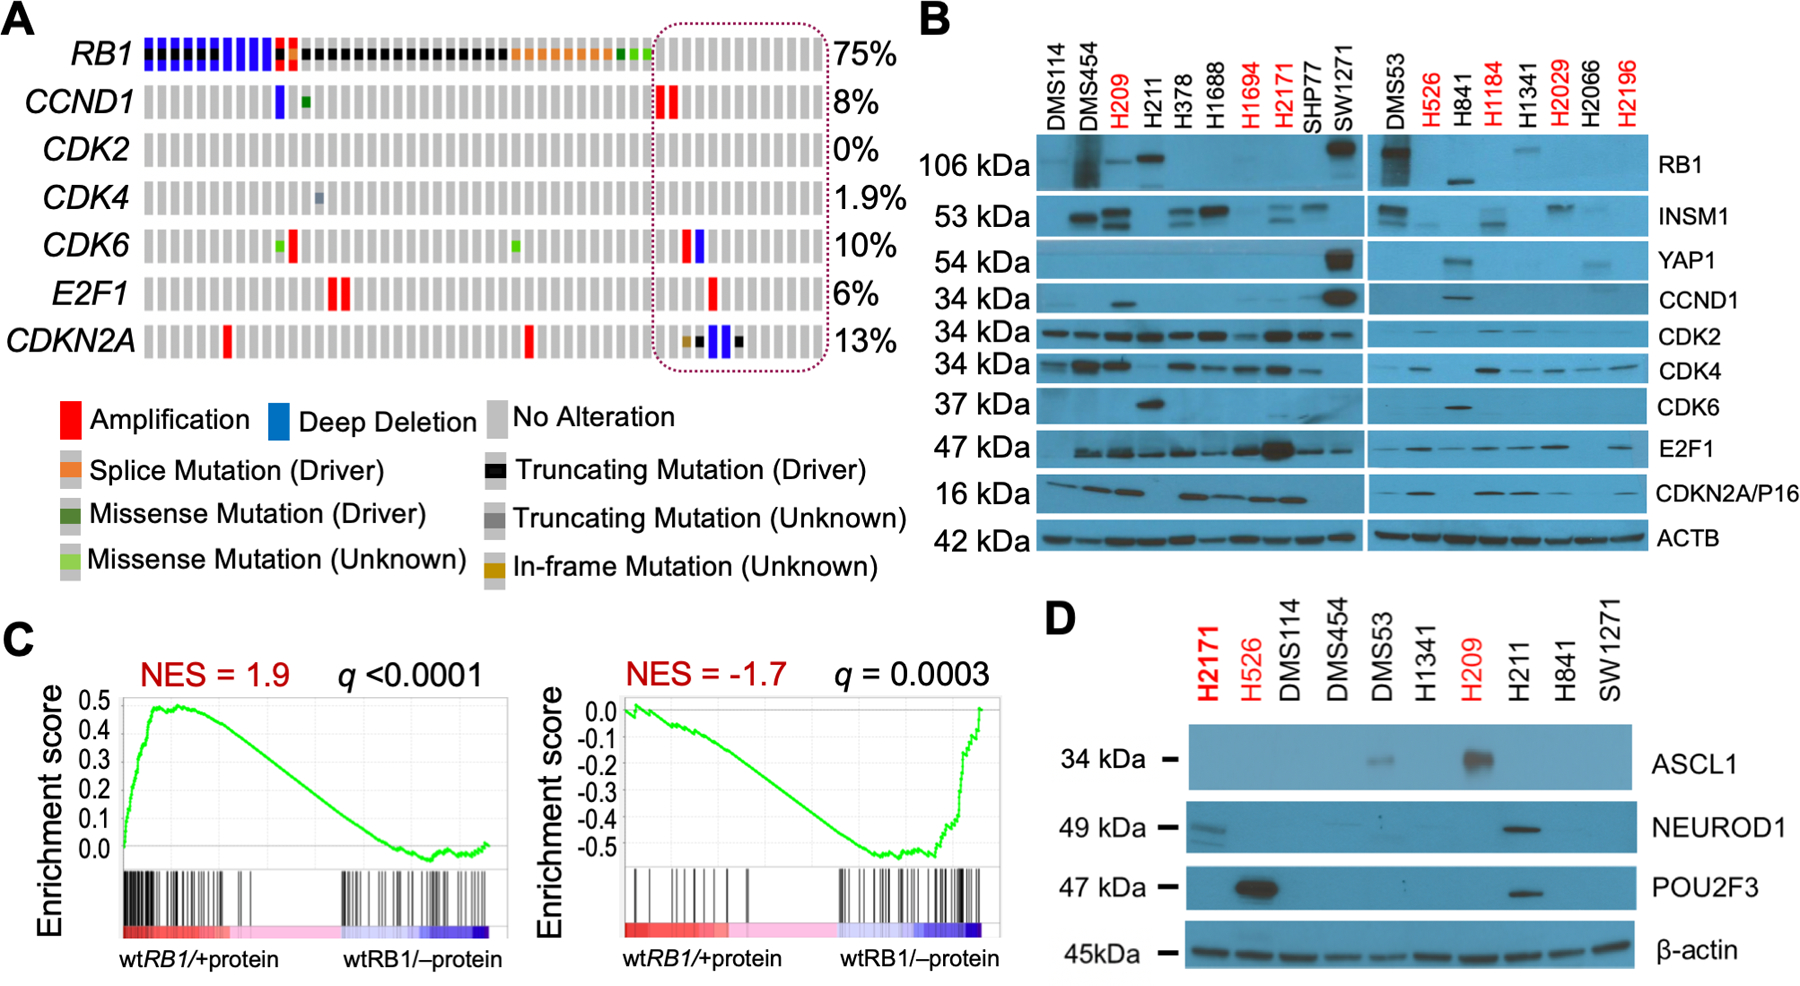
A. Oncoprint of mutations in select E2F pathway genes in SCLC cells. CCLE data (2019) for all 52 SCLC cells was visualized in cBioPortal using Oncoprint. The cells annotated as wt RB1 are circled. The genes queried were restricted to those examined by western blotting in Figure 2B. All the wt RB1 cells shown in Figure 2B are represented in the circle (column 1=DMS53, 2=DMS114, 3=DMS454, 4=H211, 5=H841, 6=H1092, 7=H1339, 8=H1341, 9=H2066, 10=H2286, 11=SBC5, 12=SHP77, 13=SW1271, L to R). B. Western blot analyses of wt RB1 (black text) and mutant RB1 (red text) cell lysates for expression of the proteins listed at right. Molecular size of bands is shown on the left. β-actin was used as a loading control. The specific mutations in the mutant RB1 cells are: H209 = missense p.C706F, H1694 = missense p.Q444L, H2171 = nonsense p.S567*, H526 = nonsense p.E31*, H1184 = nonsense p.E19*, H2029 = splice site, H2196 = splice site p.L738fs. C. GSEA analyses of wt RB1 SCLC cells with RB1 protein expression compared to wt RB1 SCLC cells lacking RB1 expression. GSEA analysis was performed using 186 RB1 LOF signature genes, including 118 downregulated and 68 upregulated genes. Downregulated genes due to RB1 loss are enriched in RB1 protein expressing cells (left panel), while upregulated genes due to RB1 loss are enriched in cells without RB1 protein (right panel). Cells used in wt RB1/+protein group: DMS114, DMS53, H1341, H211, H841, SW1271; and wt RB1/–protein group: H378, H1688, SHP77, H2066. D. Same as panel B.