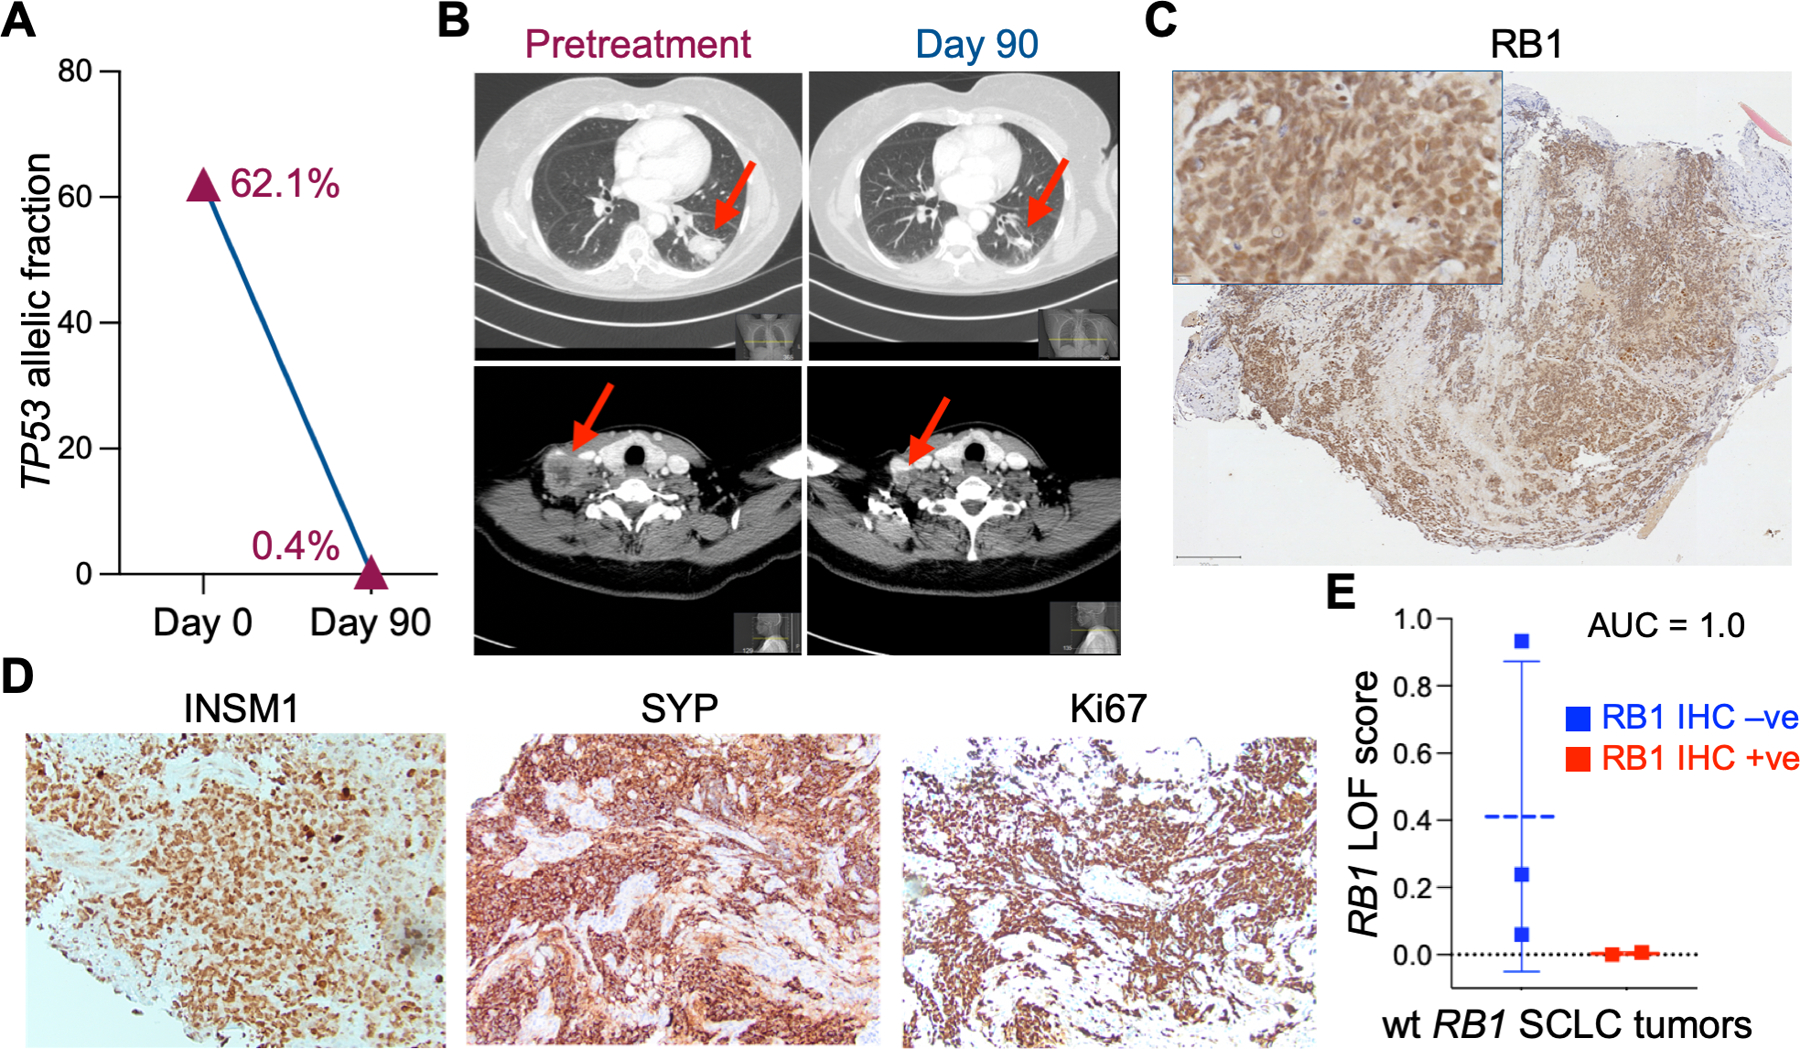
Figure 4. Response of a wt RB1 SCLC patient to abemaciclib treatment.

A. The allelic fraction of mutant TP53 in ctDNA was measured before (day 0) and during (day 92) abemaciclib treatment. B. CT scans from different axial planes of patient 2 taken before (Day 0) and during (Day 90) treatment with abemaciclib. Arrows indicate tumor in lung (top panels) and neck (bottom panels). C. RB1 IHC staining of a pretreatment biopsy of patient 2 tumor. Scale bar = 200 μM. D. Additional IHC stains of a second pretreatment biopsy of patient 2 tumor. E. RB1 LOF signature scores of wt RB1 SCLC patients with RB1 positive (+ive) IHC compared to wt RB1 patients with RB1 negative (-ve) IHC. Area under the ROC curve analysis (AUC = 1.0) showed high accuracy of the RB1 LOF classifier. Analysis of patient 2 data is included. Patient 1 had no RNA-seq data available. The four additional wt RB1 patients analyzed were not enrolled in the clinical trial.
