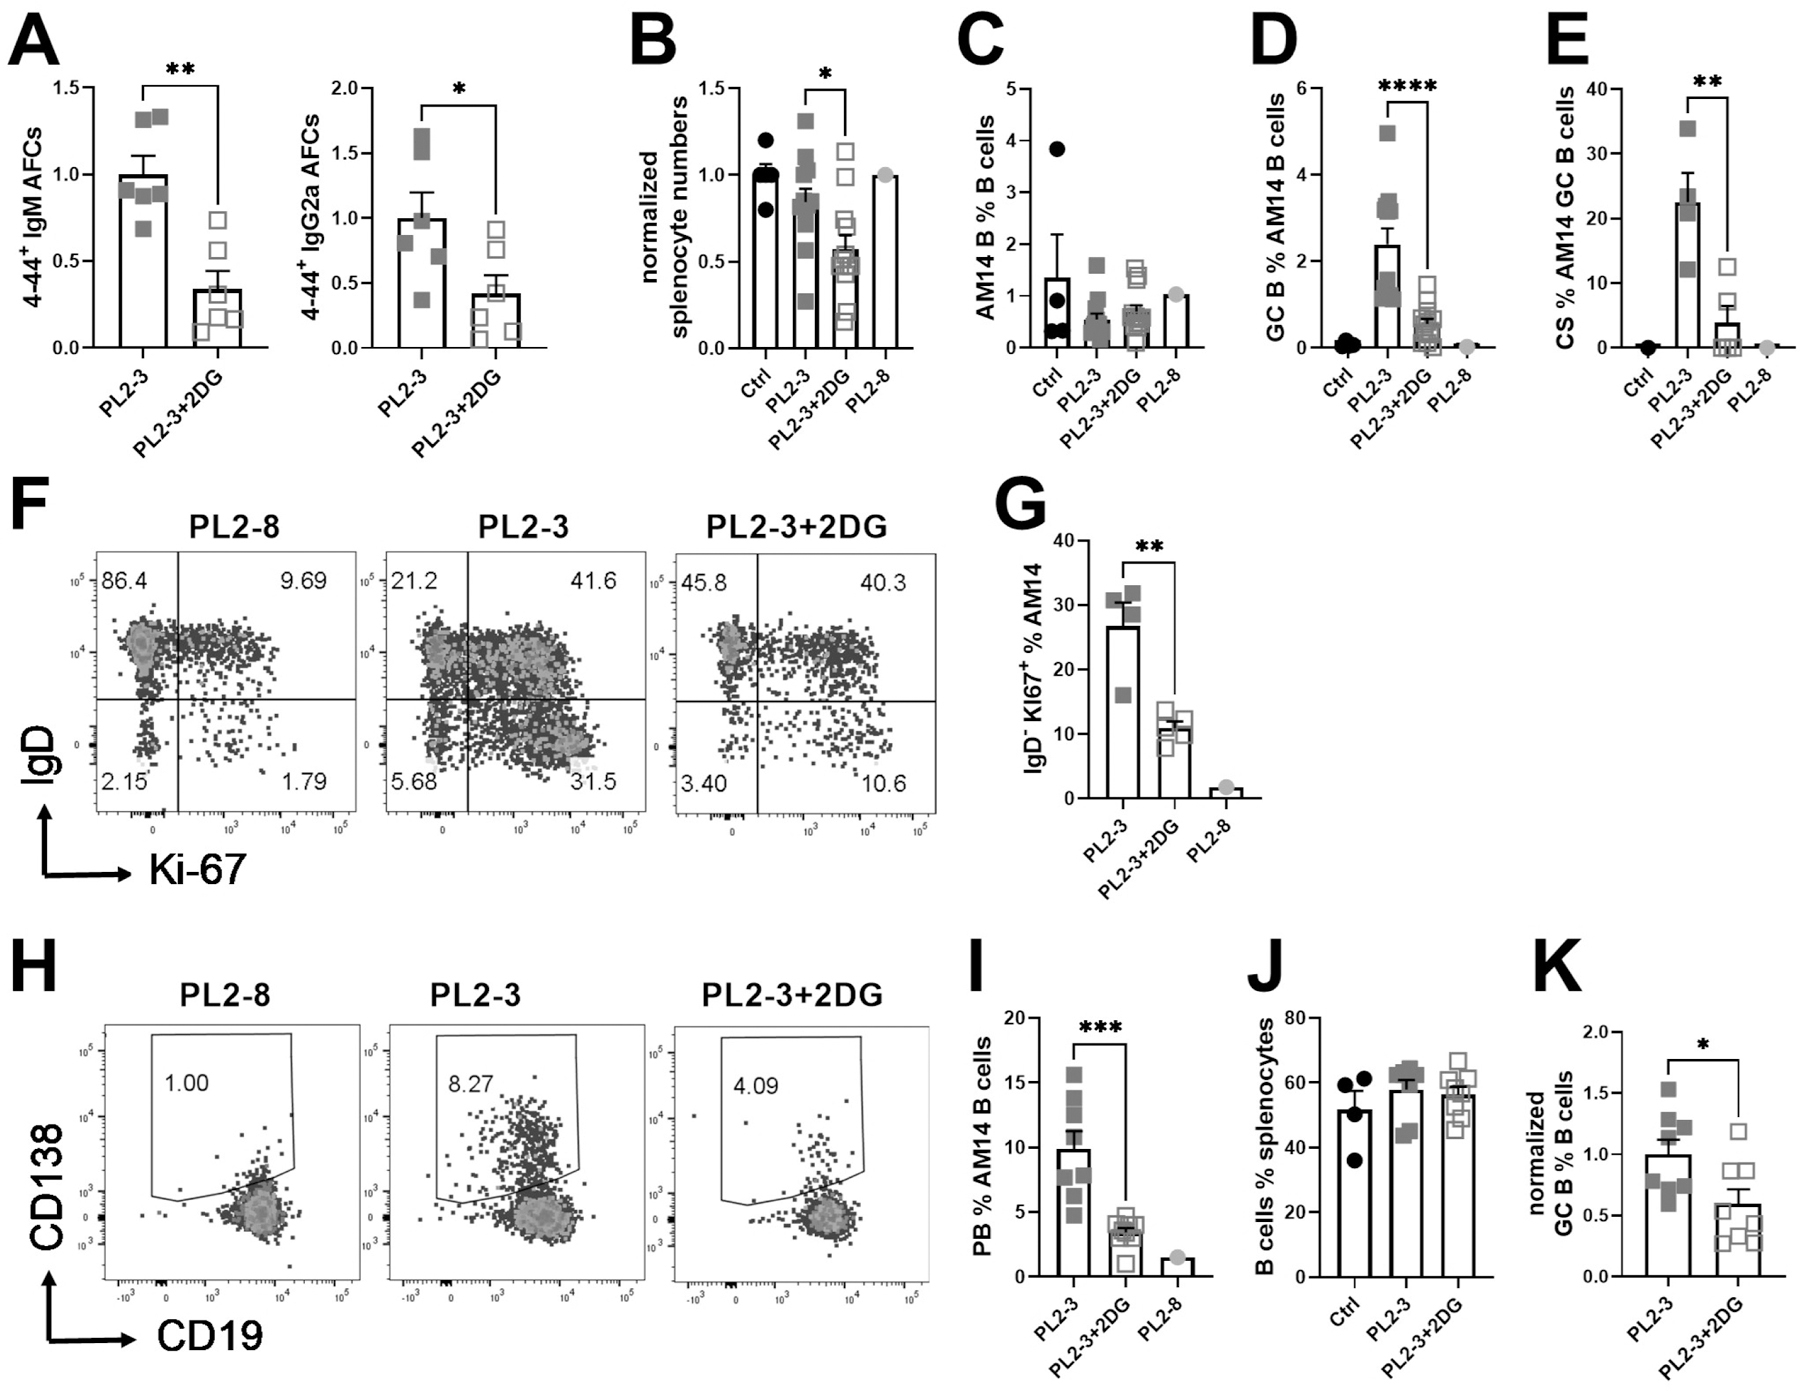
Figure 5. The inhibition of glycolysis impairs the cognate activation of AM14 B cells in the presence of T cell help.

AM14 B cells and 13C2 T cells were co-transferred into DO11.10 mice immunized with PL2-3 and treated or not with 2DG for 7 d. A. 4–44 IgM and IgG2a ELISPOTs. B. Numbers of splenocytes. C. AM14 B cell frequency among total B cells. D. Frequency of GC B cells among AM14 B cells E. CS cells frequency among GC AM14 B cells. F. Representative FACS plots of AM14 B cells stained with IgD and Ki-67. G. Frequency of IgDlow Ki-67+ among AM14 B cells. H. Representative FACS plots of AM14 PBs gated with CD19 and CD138. I. PB frequency among AM14 B cells. J. Frequency of endogenous B cells. K. Frequency of endogenous GC B cells among endogenous. Data were pooled from 3 experiments and were normalized to the mean PL2-3 values for each experiment as 1 in A, B and K. Each point represents a mouse and graphs show means and SEM. Comparisons between groups were performed with t tests. *P < 0.05; **P < 0.01. ***P < 0.001, ****P < 0.001.
