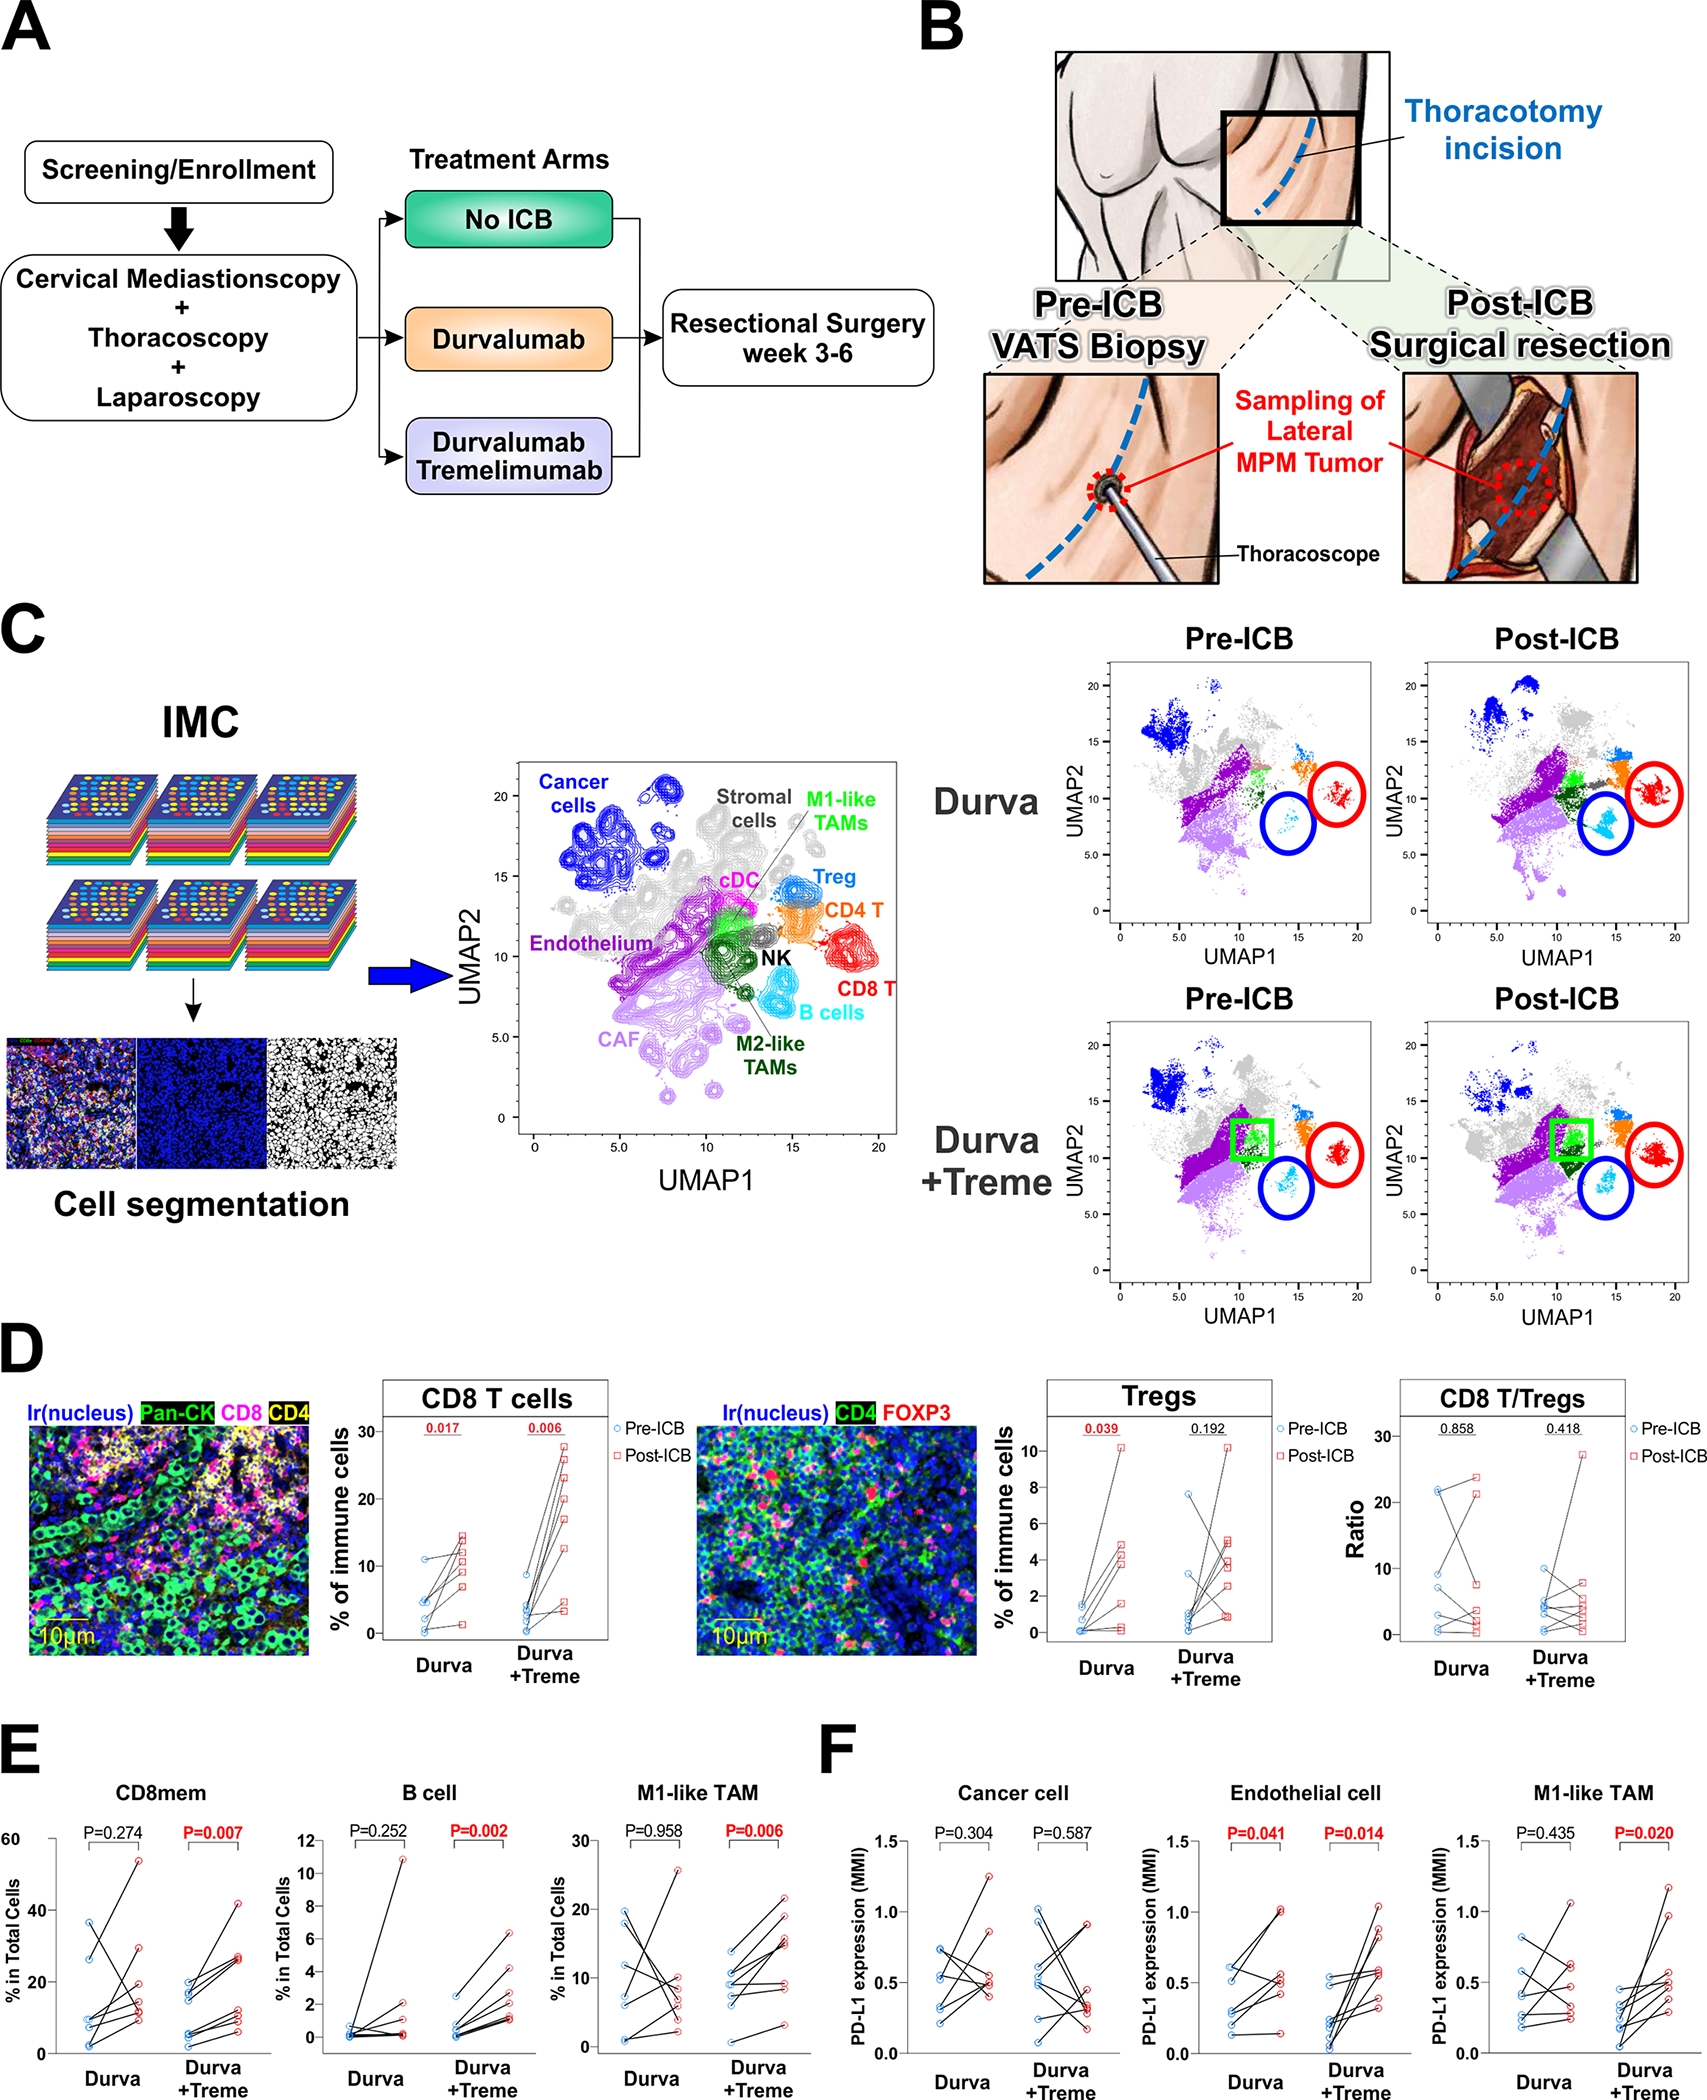
Figure 1. Reorganization of the tumor-immune contexture by neoadjuvant ICB.

A. Trial Schema. B. Tissue procurement before and after ICB. C. Imaging mass cytometry (IMC) was performed on surgically obtained tumor sections before and after ICB using 35 markers and displayed as uniform manifold approximation and projection (UMAP) plot representations of the tumor-immune microenvironment. The red circle outlines CD8 T cells, the blue circle highlights B cells, and the green square outlines M1-like TAMs. D. Primary endpoint of change in CD8/Treg ratio following dual agent neoadjuvant ICB. E. Cell populations whose frequencies significantly changed following neoadjuvant ICB are shown. F. PD-L1 alteration on cancer cells, endothelial cells, and M1-like TAM following neoadjuvant ICB.
