
Fig. 1|. Ponatinib induces cardiac dysfunction in High Fat Diet (HFD) fed ApoE−/− by promoting myeloid and T cell frequency.
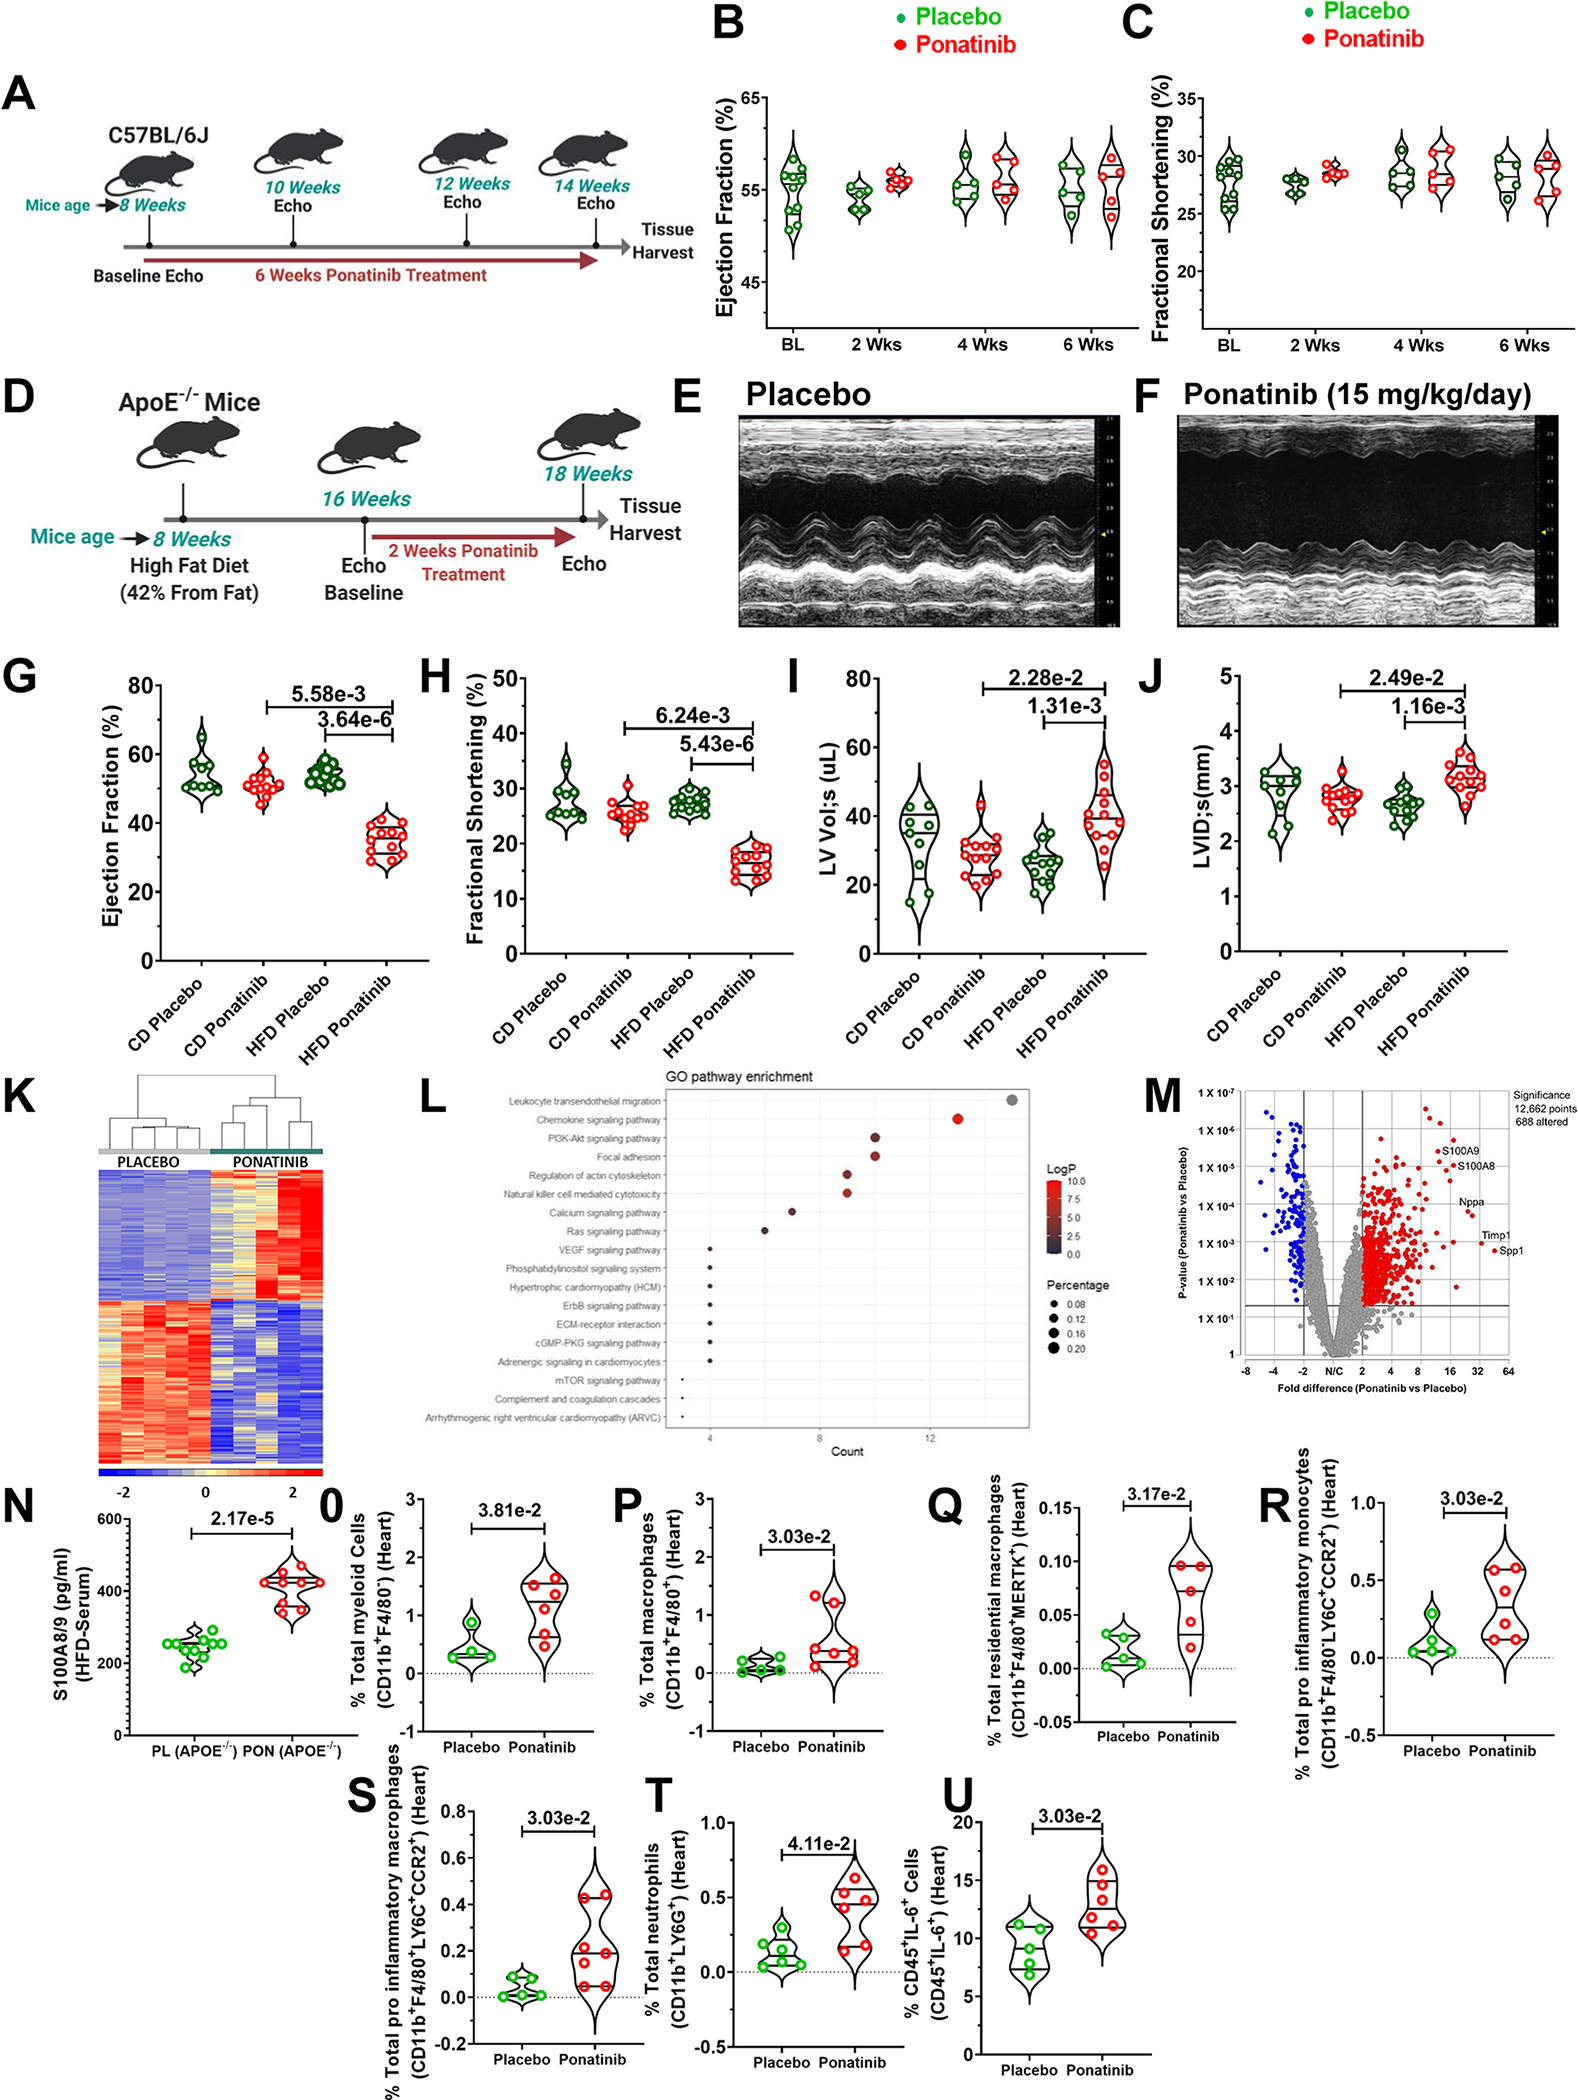
(A) An experimental scheme using 8-week-old male and female C57Bl/6J mice subjected to ponatinib treatment (15 mg/Kg/day) for 4 weeks. (B-C) Ejection Fraction and Fractional Shortening as measured by echocardiography at 2, 4, and 6 weeks. No statistically significant difference was observed in the control and ponatinib-treated group, as measured by the Mann-Whitney U test for each time point and represented as mean±SEM. Basal (BL) (N=10), placebo, and ponatinib (N=5) at 2 weeks, 4 weeks, and 6 weeks. (D) Schematic of experiment performed in which 8-week-old male and female ApoE−/− mice were subjected to high-fat diet (HFD). Chow Diet (CD) animals were used as control. After 8 weeks on HFD, mice were given ponatinib treatment (15mg/Kg/day) for 2 weeks. (E-F) Representative images of echocardiographic measurements in HFD groups. (G-J) Ejection Fraction, Fractional Shortening, Left ventricle volume in systolic (LV Lol;s), and Left ventricle internal diameter in systolic (LVID;s) were measured by echocardiography. Significance was determined by using Kruskal-Wallis followed by Dunn test and represented as mean±SEM CD placebo (N= 9); CD ponatinib, HFD placebo, and HFD ponatinib (N= 12). (K) RNA sequencing (RNA-Seq) analysis of LV samples from HFD placebo and HFD ponatinib groups was performed at 2 weeks after ponatinib treatment by taking LV samples from HFD placebo and HFD ponatinib groups. N=5 per group. The hierarchical clustering of 544 genes was detected as a notably differential between the HFD placebo and HFD ponatinib groups. (L) Dot enrichment plot. (M) Volcano plot of differentially expressed genes. (N) ELISA for quantitative measurement of S100A8/9 from the serum sample of ponatinib treated HFD- fed ApoE−/− mice, placebo (PL) (N=10), and ponatinib (PON) (N=9). (O-U) Quantitation of immune cells as a percentage of total cells (immune and nonimmune) isolated from the digested heart of HFD placebo and HFD ponatinib groups. (O) total percentage of myeloid cells per heart (CD11b+F4/80−), placebo (N=4) and ponatinib (N=6), (P) total percentage of macrophages (CD11b+F4/80+), placebo (N=5) and ponatinib (N=7), (Q) total percentage of residential macrophages (CD11b+F4/80+MERTK+), placebo (N=5) and ponatinib (N=5), (R) total pro-inflammatory monocytes (CD11b+F4/80−LY6C+CCR2+), placebo (N=5) and ponatinib (N=6), (S) total pro-inflammatory macrophages (CD11b+F4/80+LY6C+CCR2+), placebo (N=5) and ponatinib (N=7), (T) total neutrophils (CD11b+LY6G+), placebo (N=6) and ponatinib (N=6), (U) percentage of IL-6 producing leukocytes (CD45+IL-6+), placebo (N=5) and ponatinib (N=6), Data (O-U) were analyzed using the Mann-Whitney U test and represented as mean±SEM.