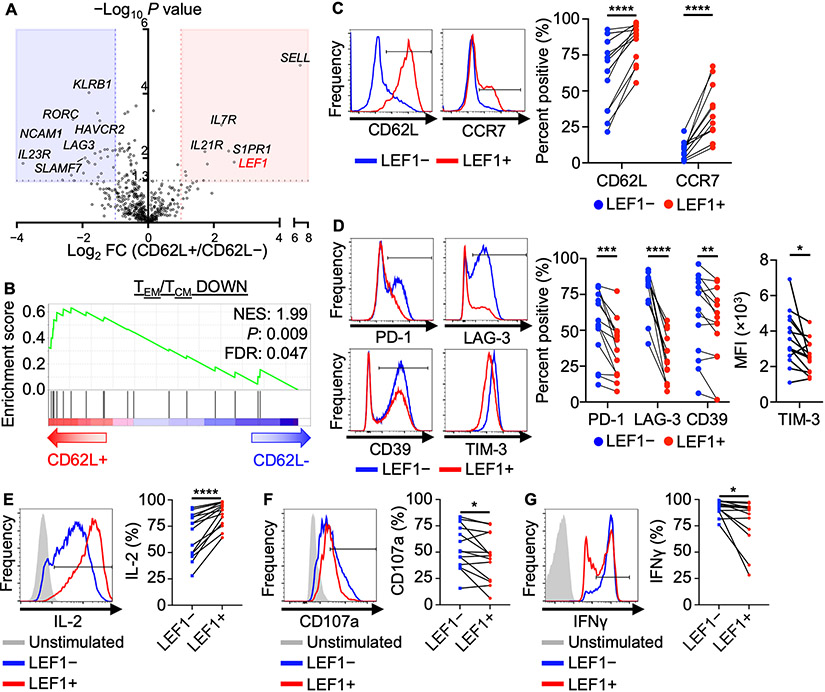
Figure 1: CD62L+ NKTs express elevated levels of Wnt transcription factor LEF1 and are phenotypically central memory–like.
A, Twelve days after primary stimulation with αGalCer-pulsed autologous PBMCs, NKTs were magnetically sorted into CD62L+ and CD62L− subsets and processed for RNA isolation and Nanostring gene expression analysis. Volcano plot shows differential gene expression in CD62L+ versus CD62L− NKTs with P value cutoff at 0.05. B, Gene set enrichment analysis (GSEA) plot showing enrichment for a central memory CD4+ T-cell signature (GSE11057) in CD62L+ NKTs. C-D, Twelve days after stimulation, NKTs were gated into LEF1− (blue) and LEF1+ (red) populations, and surface expression of (C) central memory markers and (D) activation/exhaustion markers were measured by flow cytometry. Representative donor histograms and paired percent positive or MFI (n = 16 donors) are shown. E–G, Ten days after stimulation, NKTs were activated by 50 ng/ml PMA and 500 ng/ml ionomycin in the presence of GolgiPlug and GolgiStop and analyzed for (E) IL2, (F) CD107a, and (G) IFNγ expression by flow cytometry. Representative histograms and paired percent positive (n = 12 donors) are shown. *P < 0.05, **P < 0.01, ***P < 0.001, ****P < 0.0001, ns: not significant, paired Student’s t test for paired result from each donor.

