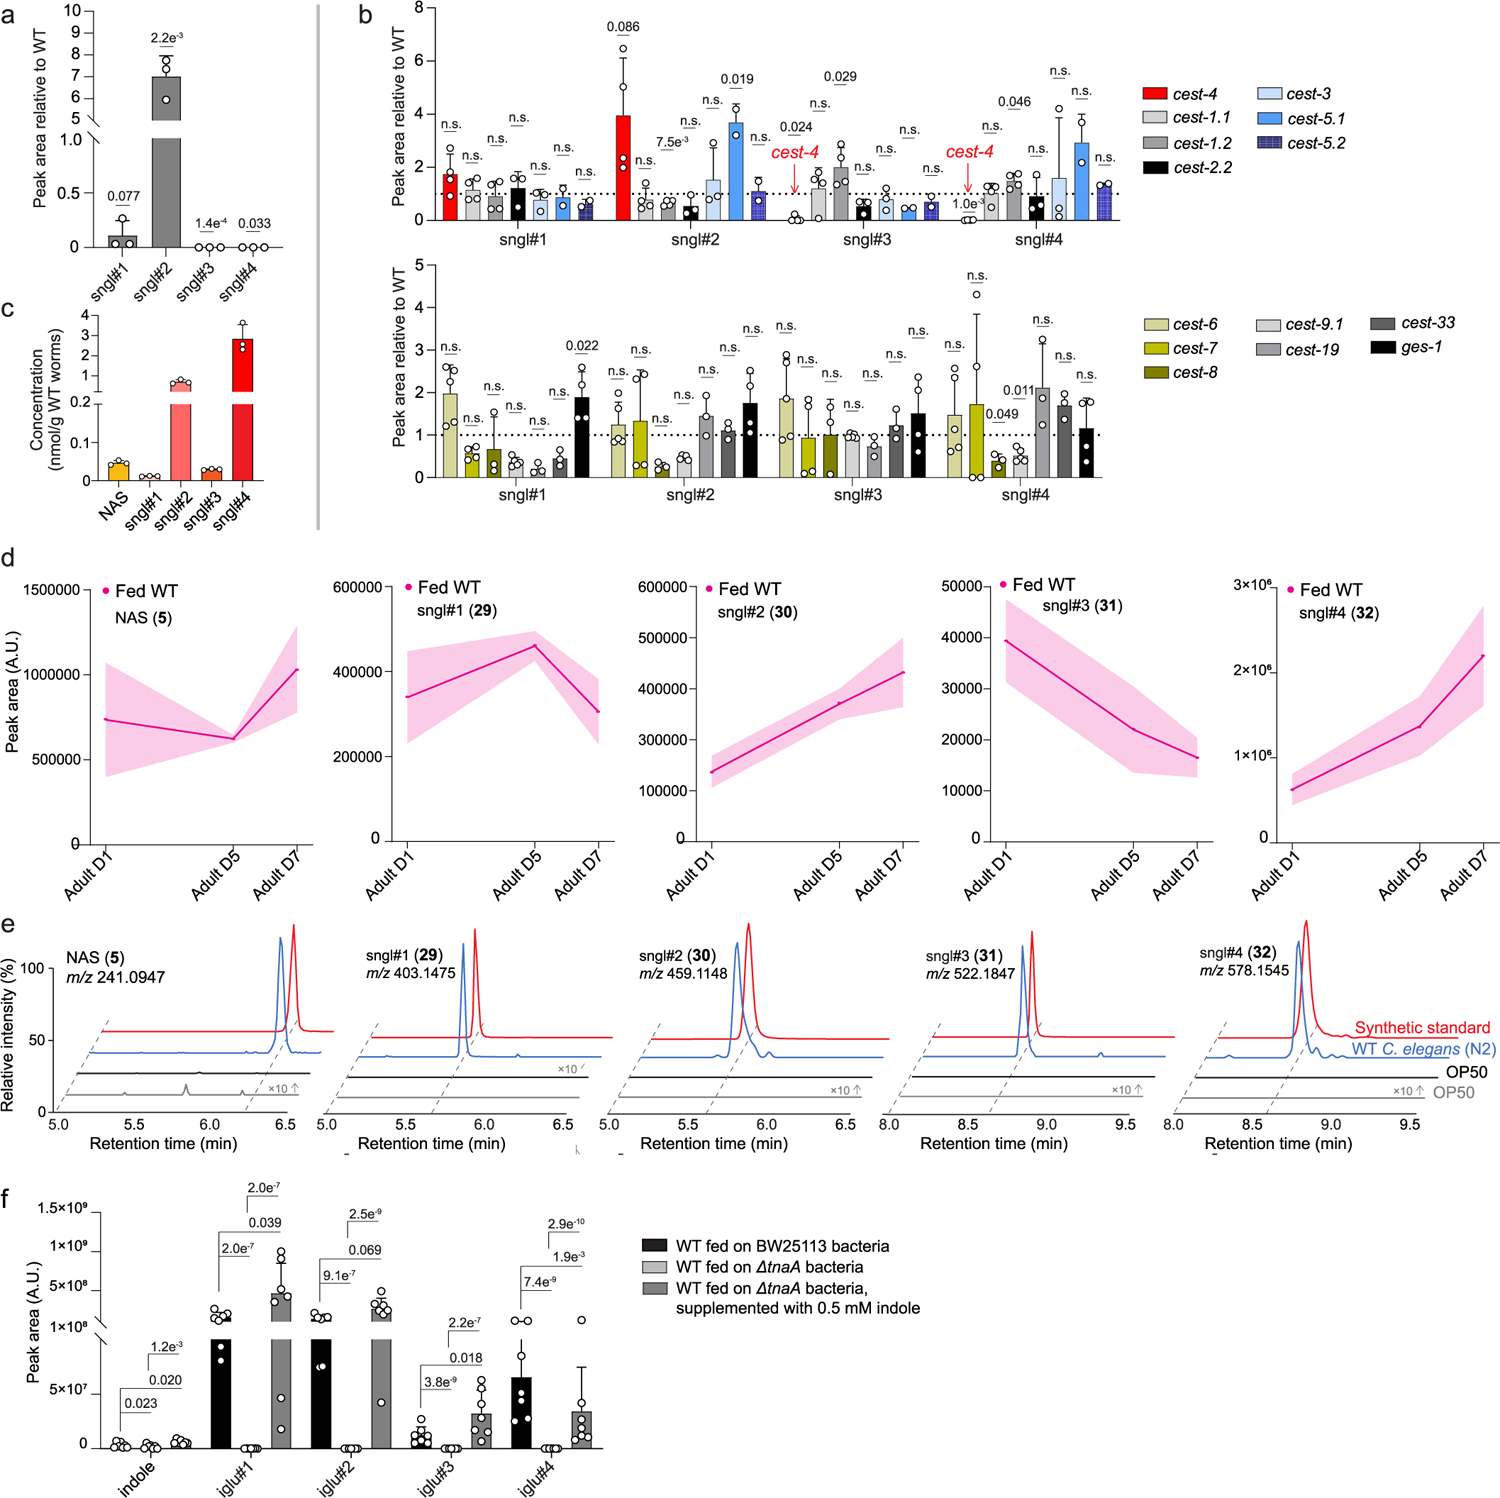
Extended Data Fig. 5 |. Life stage, starvation, and microbial metabolism affect serotonin metabolite biosynthesis.

a, Abundances of sngl#1–4 in exo-metabolomes of glo-1 mutants relative to WT. b, Abundances of sngl#1–4 in cest mutants (cest-4, cest-1.1, cest-1.2, cest-2.2, cest-3, cest-5.1, cest-5.2, cest-6, cest-7, cest-8, cest-9.1, cest-19, cest-33, ges-1) relative to WT. n.d., not detected. c, Absolute concentrations of NAS, sngl#1, sngl#2, sngl#3, and sngl#4 in WT C. elegans at day 7 of adulthood. d, Abundances of sngl#1–4 in the endo-metabolomes of WT C. elegans at day 1, day 5, and day 7 of adulthood. e, ESI+ and ESI− ion chromatograms for NAS and sngl#1–4 in endo-metabolomes of E. coli OP50 and WT C. elegans, demonstrating that NAS and serotonin glucosides sngl#1–4 are not produced by OP50. f, Abundances of free indole and iglu#-family metabolites in endo-metabolome samples of WT C. elegans fed BW25113 or ΔtnaA E. coli bacteria. Data in a (n = 3), b (n = 2–4), c (n = 3), d (n = 3), and f (n = 7) represent biologically independent experiments, and bars indicate mean ± s.d., p-values calculated by unpaired, two-tailed t-test with Welch correction; n.s., not significant.
