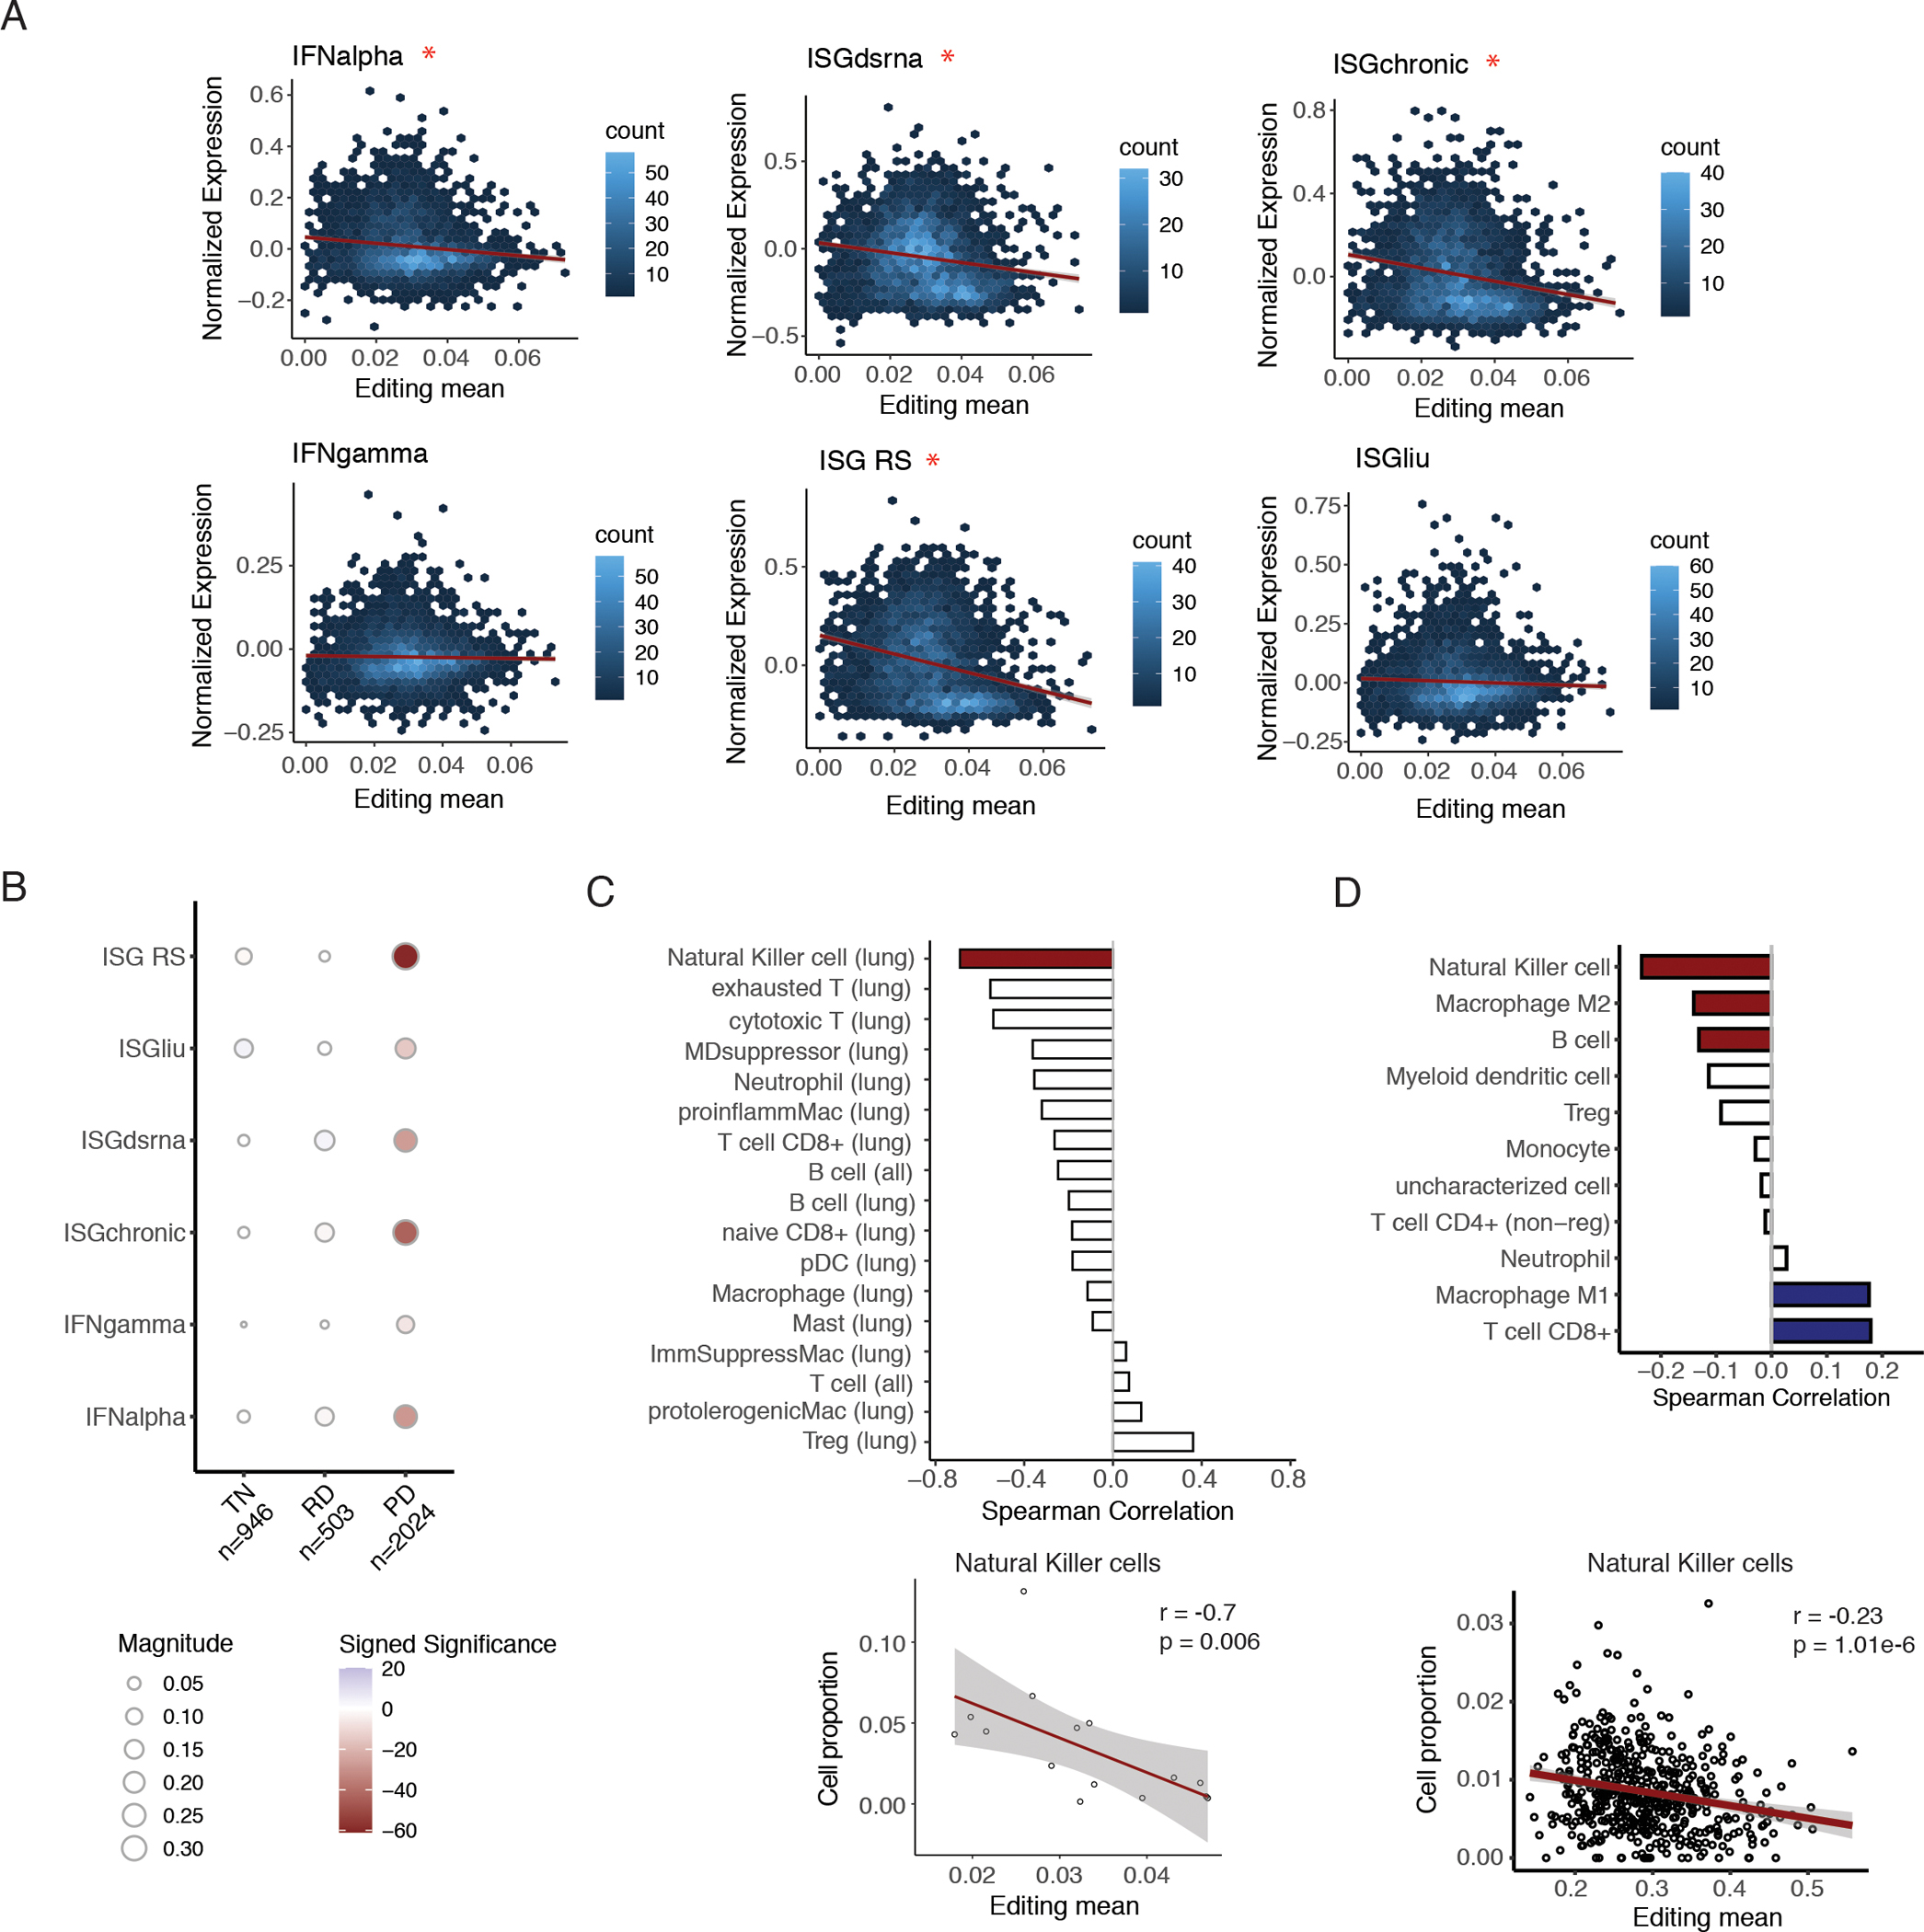
Fig. 4.

Editing in cancer cells associated with immune suppression.
A. Hexagonal 2-dimensional histograms of mean editing level and mean normalized ISG expression in single cancer cells for multiple ISG signatures. Mean editing level was calculated using editing levels of all sites for each cell. Red asterisk indicates a significant negative spearman correlation, with FDR-adjusted p-value < 0.05. B. Spearman correlations between mean editing levels and mean expression of multiple ISG signatures across single cancer cells, grouped by treatment time point. The number of cancer cells within each category is listed in the x-axis labels. The size of each circle indicates the magnitude of the Spearman correlation coefficient, and the color intensity corresponds to significance of the adjusted p-value. Blue: positive correlations, red: negative correlations. TN stands for treatment naïve, RD stands for residual disease, and PD stands for progression. C. Top: Bar plot showing Spearman correlations between cancer editing levels and infiltration of different immune cell types. For each tumor, single cancer cells were pooled, and overall cancer editing level was calculated as the mean editing level of all sites in the pooled cancer cells. Red bar: significant correlation with p < 0.05. Nonsignificant correlations are shown in white. For each cell type, in parentheses, lung signifies that only lung biopsies were included. In contrast, ”all” signifies all samples were included. Bottom: scatterplot of cancer editing and infiltration of Natural Killer cells, with Spearman correlation coefficient and p-value listed. D. Top: Bar plot of Spearman correlations between tumor-increased editing and estimated infiltration of different immune cell types in bulk TCGA LUAD tumors. Tumor-increased editing was calculated as the mean editing level over sites with significantly higher editing levels in tumors than in matched non-malignant samples. Colored bars indicate significance by FDR-adjusted p < 0.05, with positive correlations in blue and negative ones in red. Nonsignificant correlations are shown in white. Bottom: scatterplot of tumor-increased editing and quanTIseq-estimated proportion of Natural Killer cells with Spearman correlation coefficient and p-value shown.
