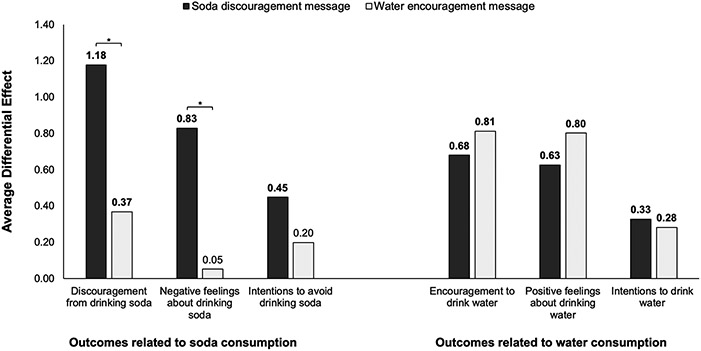
Figure 3.
Impact of the soda discouragement and water encouragement messages on outcomes related to soda consumption and water consumption, n=1,078 U.S. parents of children ages 2–12
Note. Figure shows main effects (unconditional Average Differential Effects [ADEs]) for exposure to each beverage message (soda discouragement message or water encouragement message) compared to no exposure. ADEs shown in boldface are statistically significant, p<0.001. *indicates that ADEs for the soda discouragement message and water encouragement message differed from one another, p<0.001.

