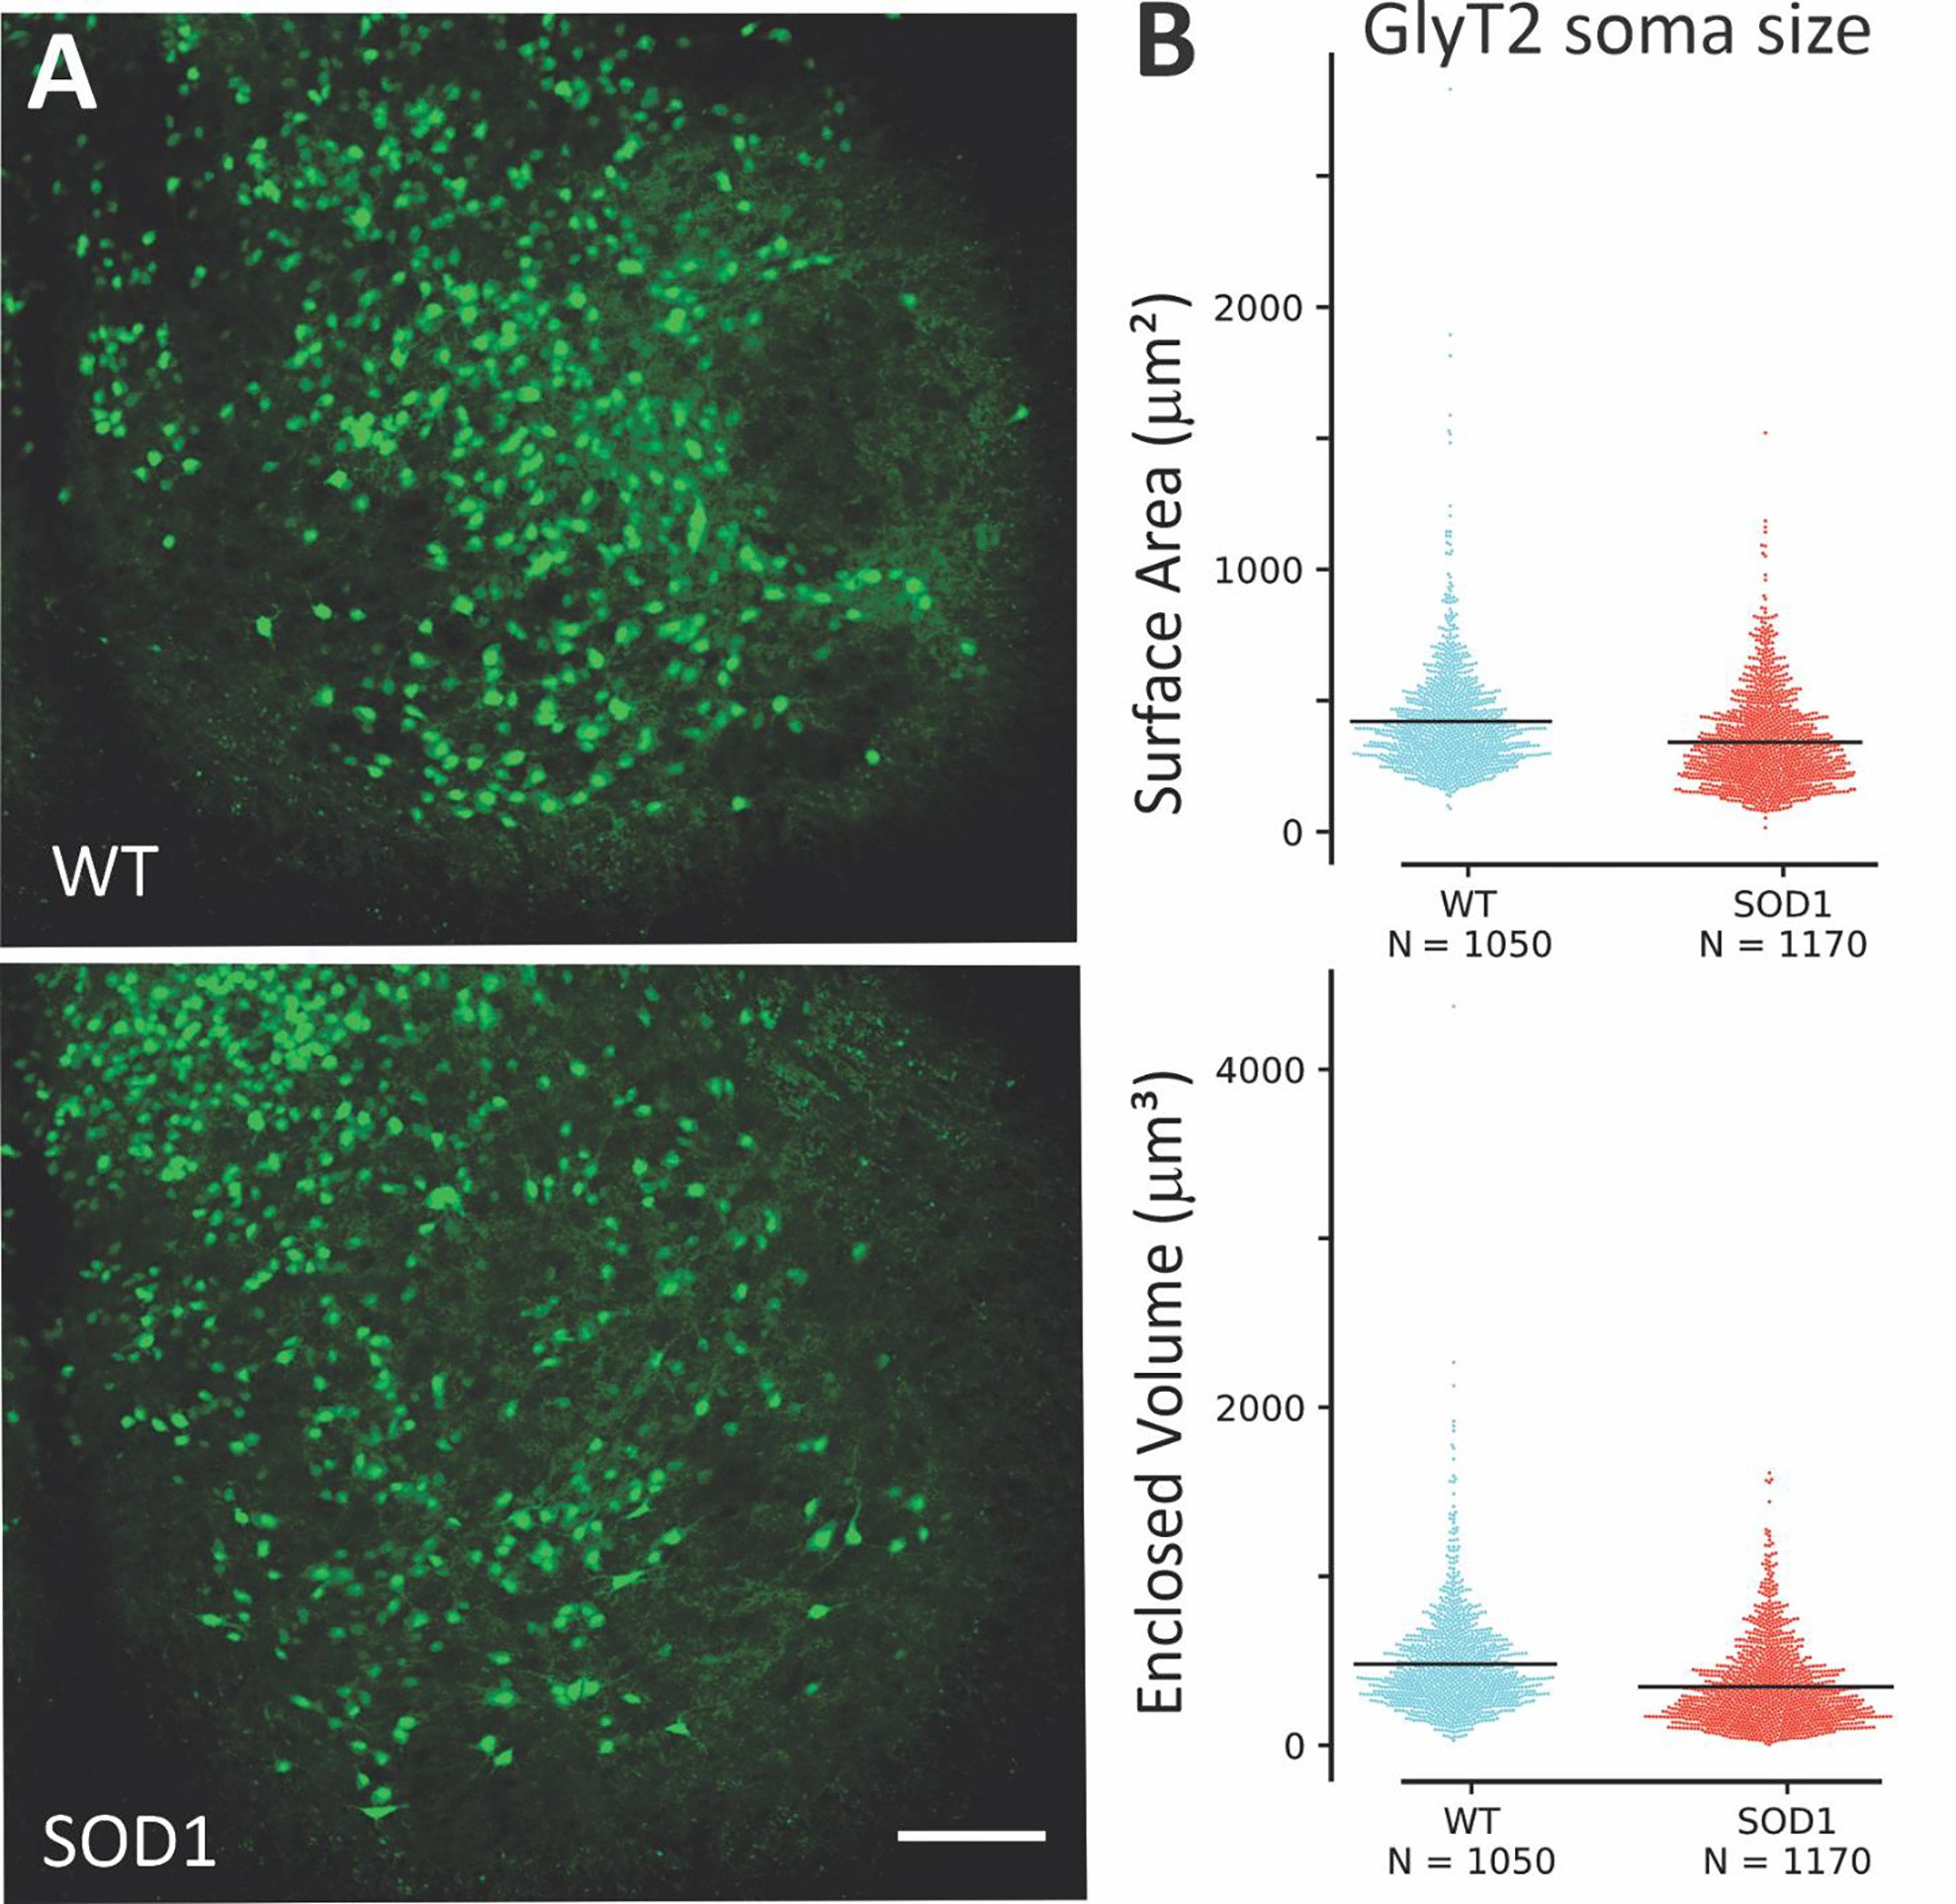
Figure 1: Comparing size of GlyT2 interneurons in the ventral horn.

Representative photomicrographs of spinal cord showing GFP interneurons (green) in A. (B) Morphological analysis showed there was little difference in size between SOD1 glycinergic interneurons in ventral horn (N = 1170 neurons from 6 mice) and WT (N = 1050 neurons from 6 mice). Based on a linear mixed model differences are not significant. Scale bar in A: 100 μm applies to both images.
