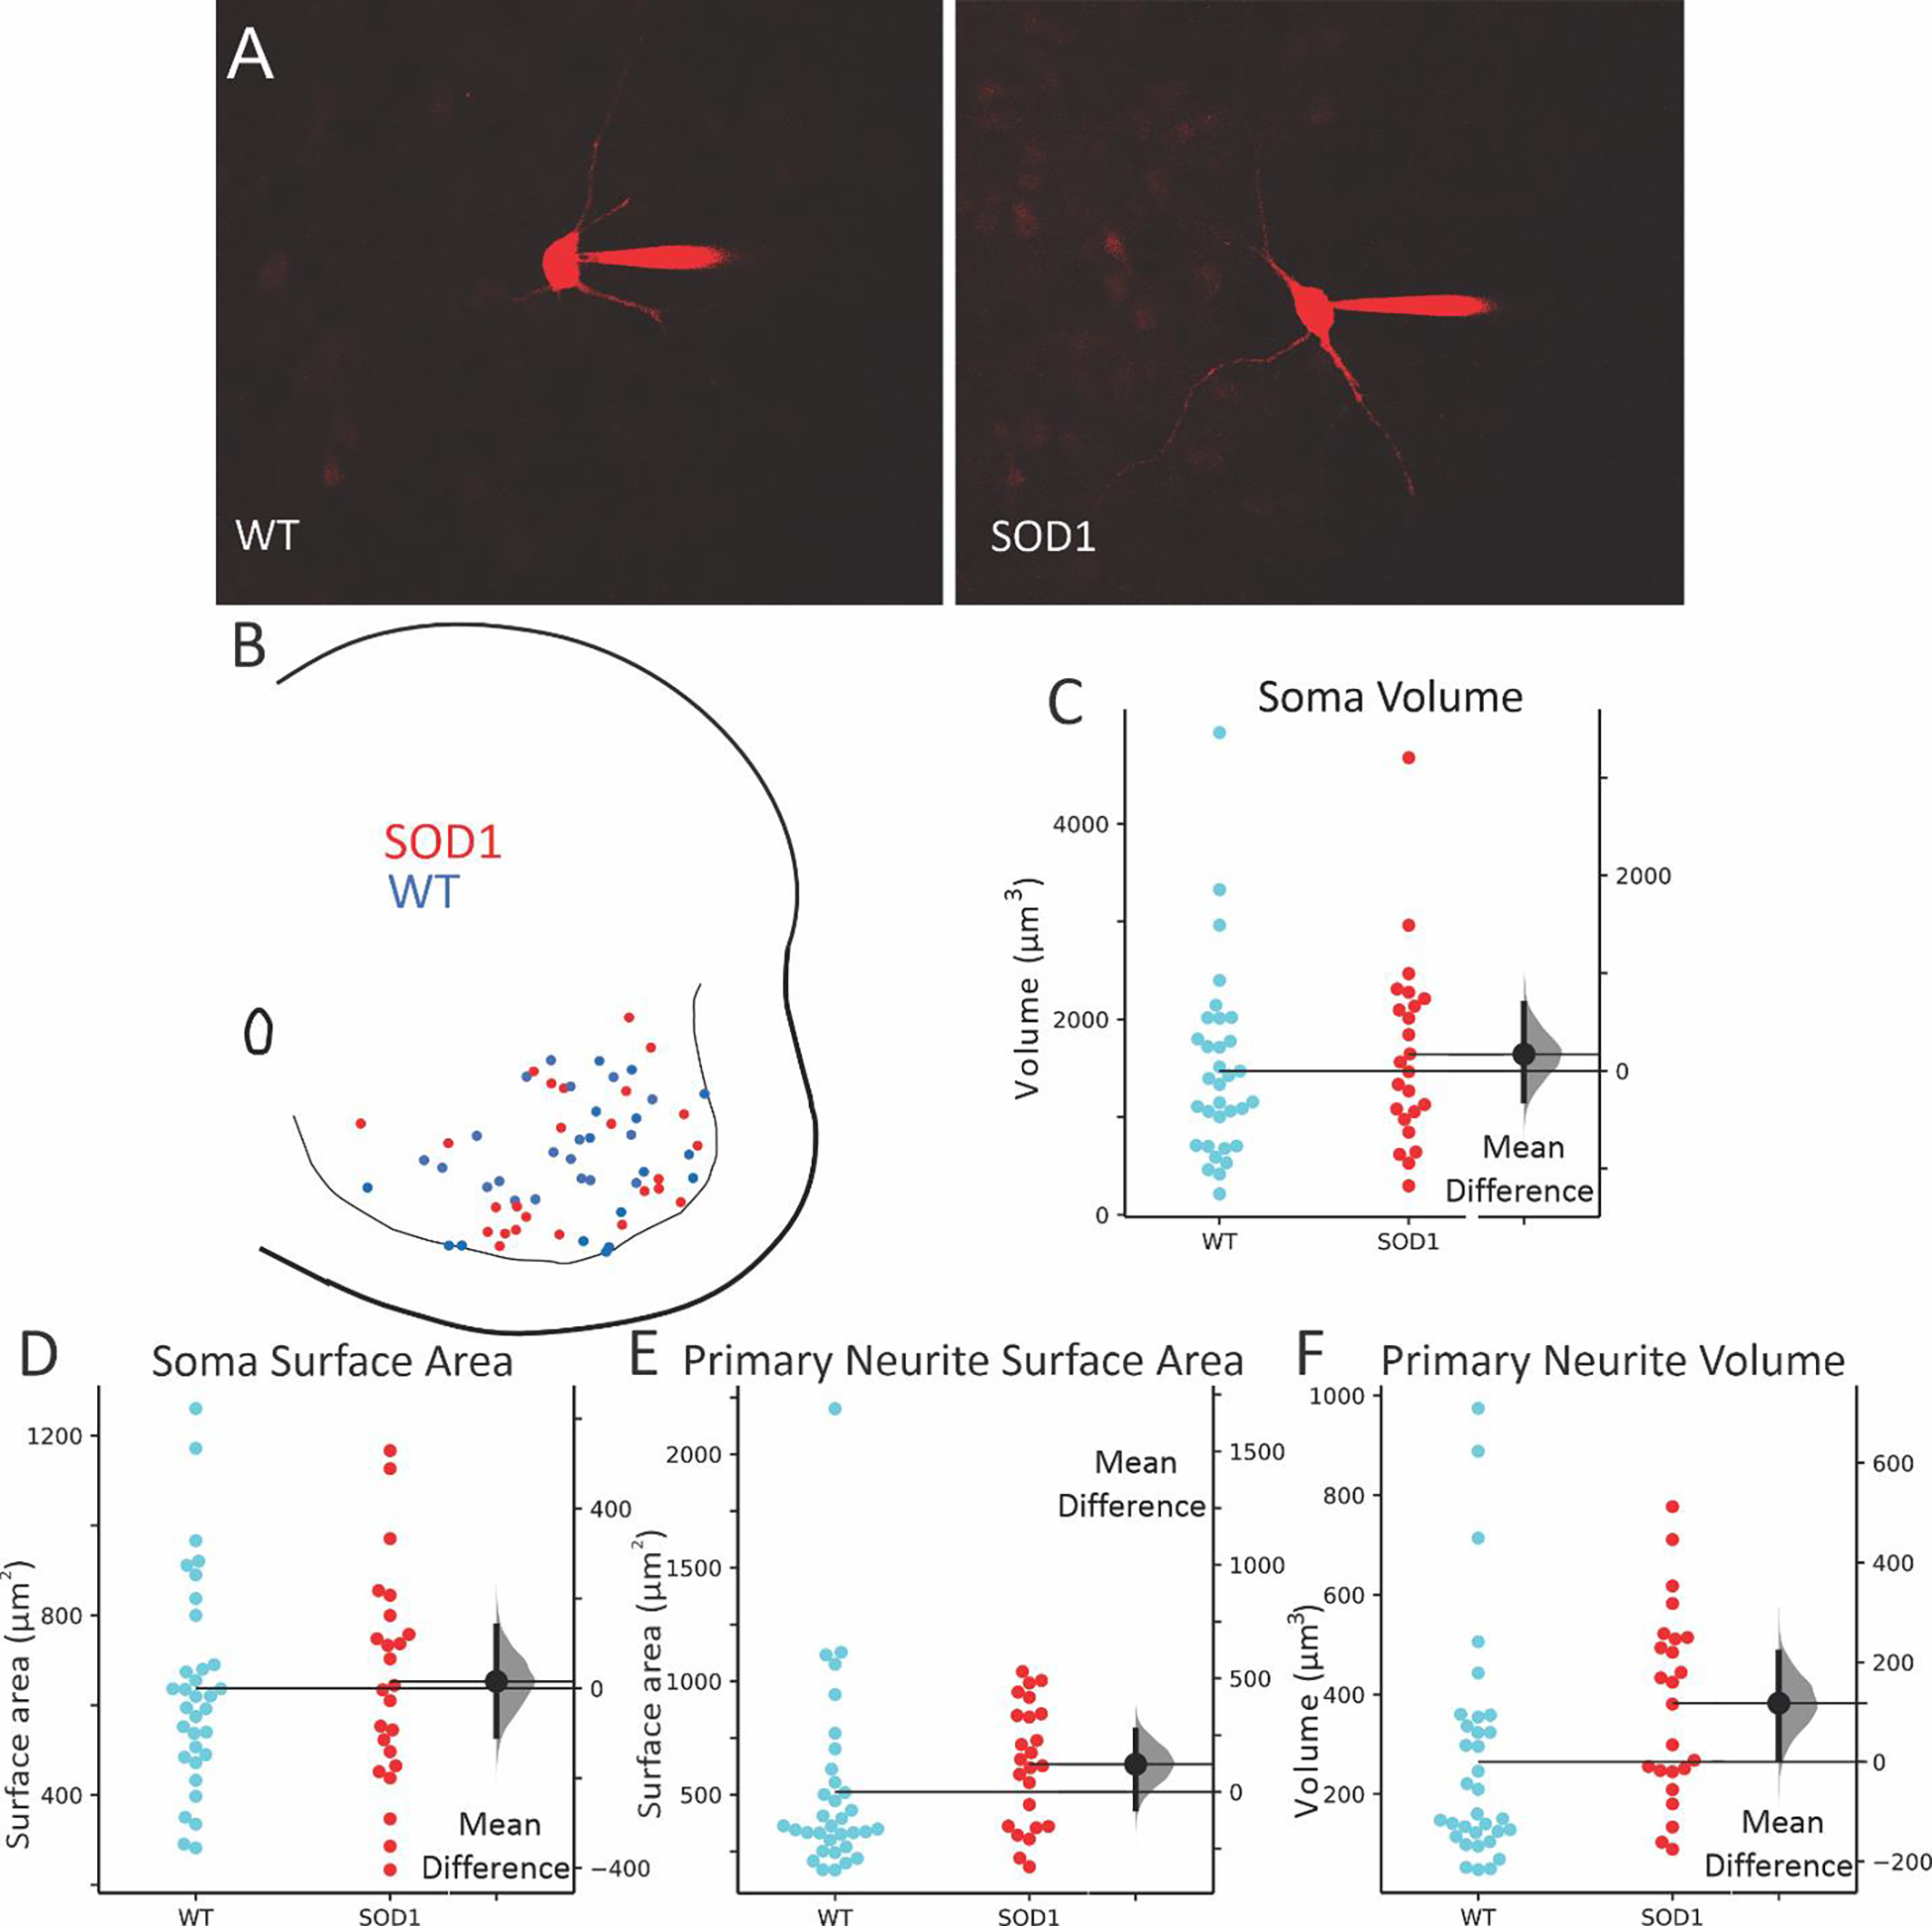
Figure 2: GlyT2 interneurons from WT and SOD1 mice were patched throughout the ventral horn.

Images of typical interneurons, filled with Texas Red as they were recorded in A, and locations of all patched interneurons in B (WT = blue circles, SOD1 = red circles). Consistent with previous results, soma volume (C) and soma surface area (D) were unchanged in patched neurons, while total surface area and total volume of primary neurites (E and F) were modestly larger in SOD1 interneurons than in WT. Effect sizes are shown to the right of each swarm plot, with distribution of the 95% CI of the effect sizes in grey to the right of the mean difference (SOD1 – WT).
