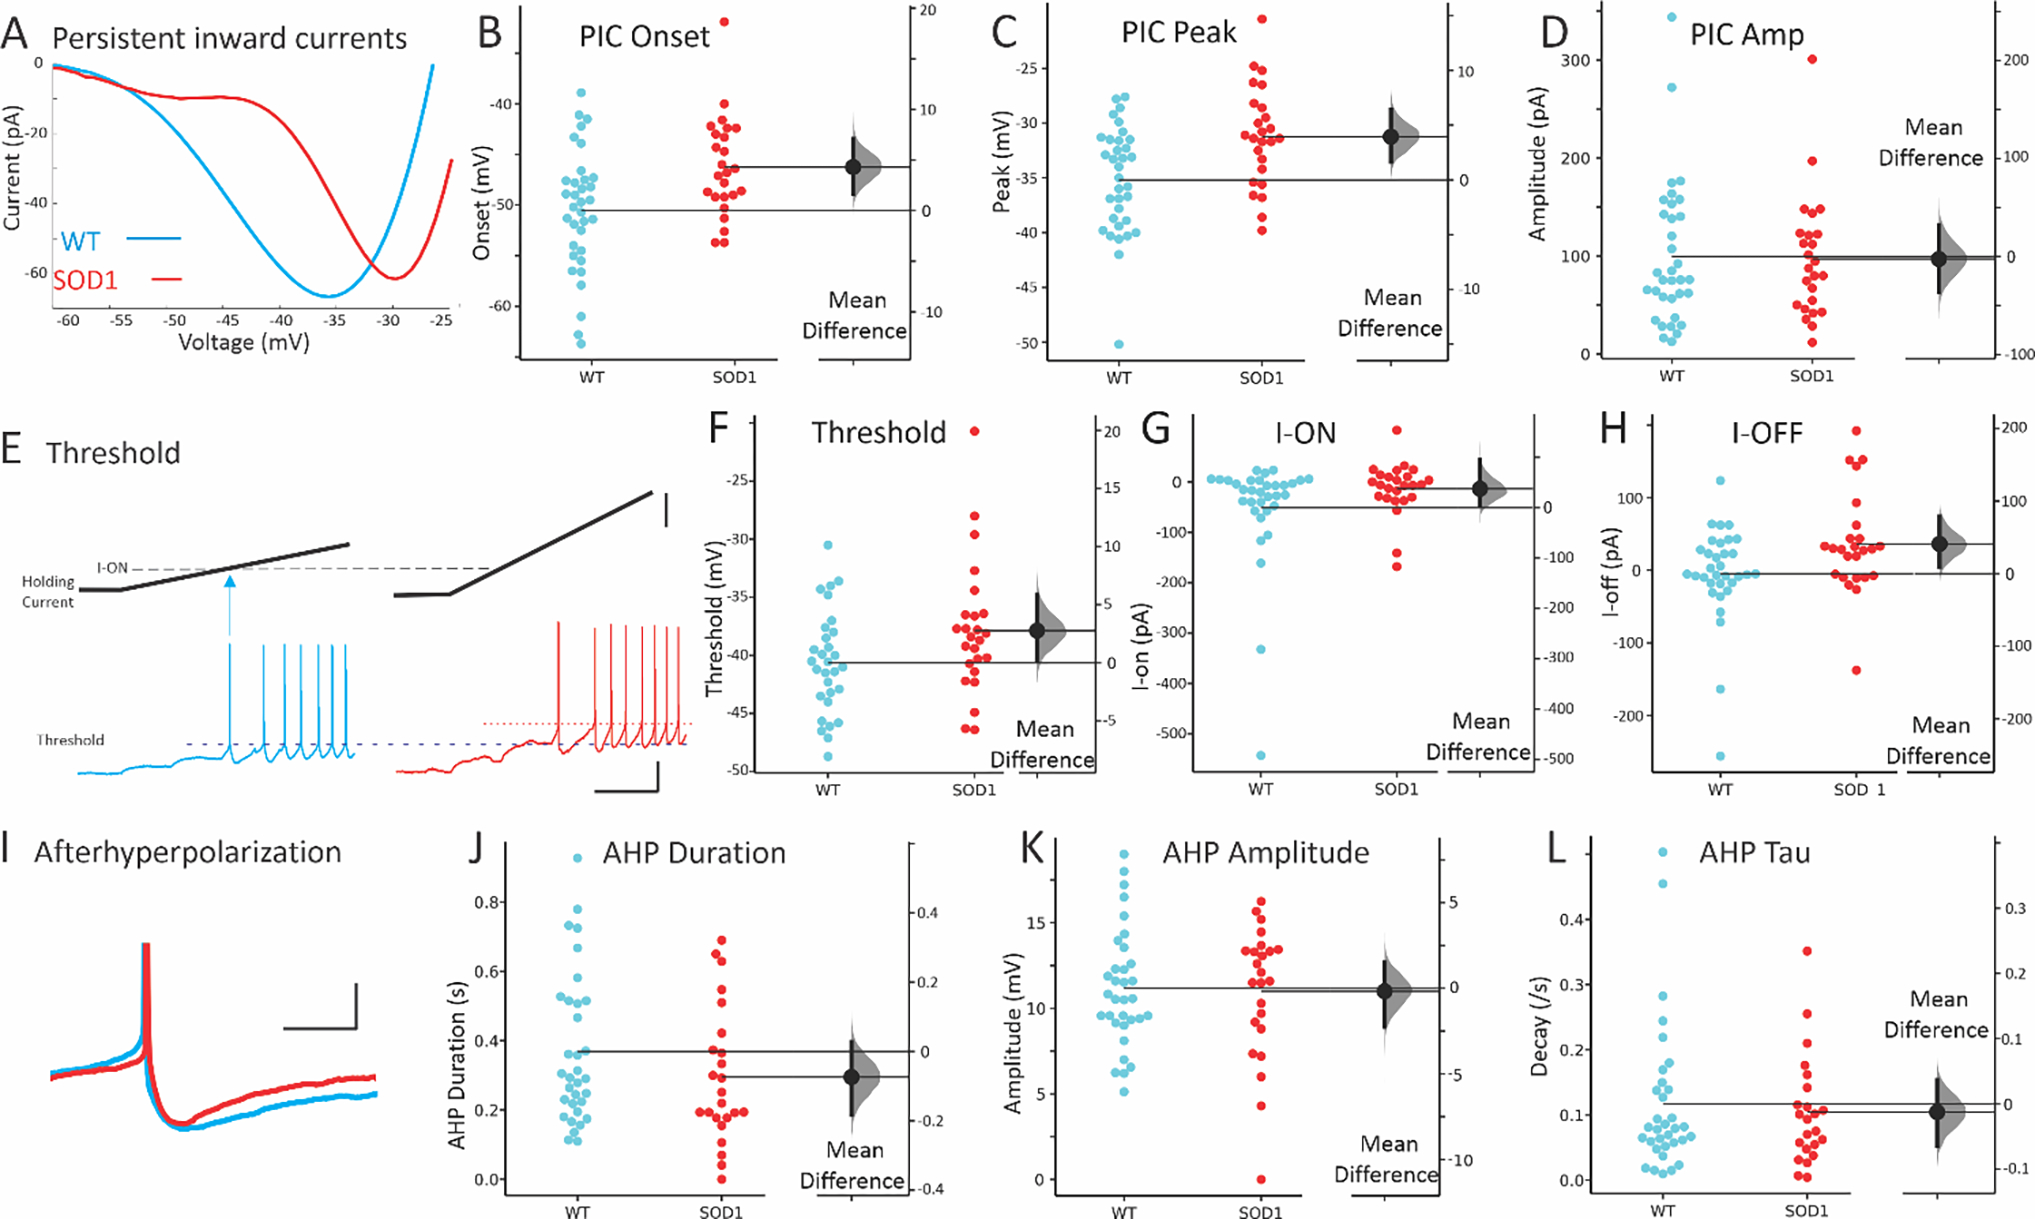
Figure 3: Electrophysiology of SOD1 glycinergic interneurons.

The most prominent difference in SOD1 interneurons was the shift in voltage dependence of PICs. (A) Representative, leak-subtracted current-voltage relationship of PICs from WT (P8) and SOD1 (P6) interneurons. (B-D) Mean onset, peak and amplitude of PICs in WT (blue symbols on left) and SOD1 interneurons (red symbols on right). (E-F) Threshold for action potentials evoked with current ramps was higher in SOD1 interneurons (compare dotted lines indicating voltage threshold). Starting potential for both interneurons was −65 mV. The current at firing onset and offset (I-ON and I-OFF, respectively) was also increased as shown in G-H. (I) The duration of the AHP in SOD1 interneurons appeared shorter, as shown in a representative P8 WT and P7 SOD1 interneuron and cumulative data for total duration of AHP in J. However, neither the AHP amplitude nor the AHP decay time constant, tau, were significantly altered in SOD1 glycinergic interneurons, as shown in K-L. Vertical scale bars in E: top = 50 pA, and bottom = 20 mV. Horizontal scale bar in E = 0.5s and all scale bars apply to both left and right panels. Vertical scale bar in H = 10 mV (APs were truncated from image), and horizontal scale bar = 50 ms.
