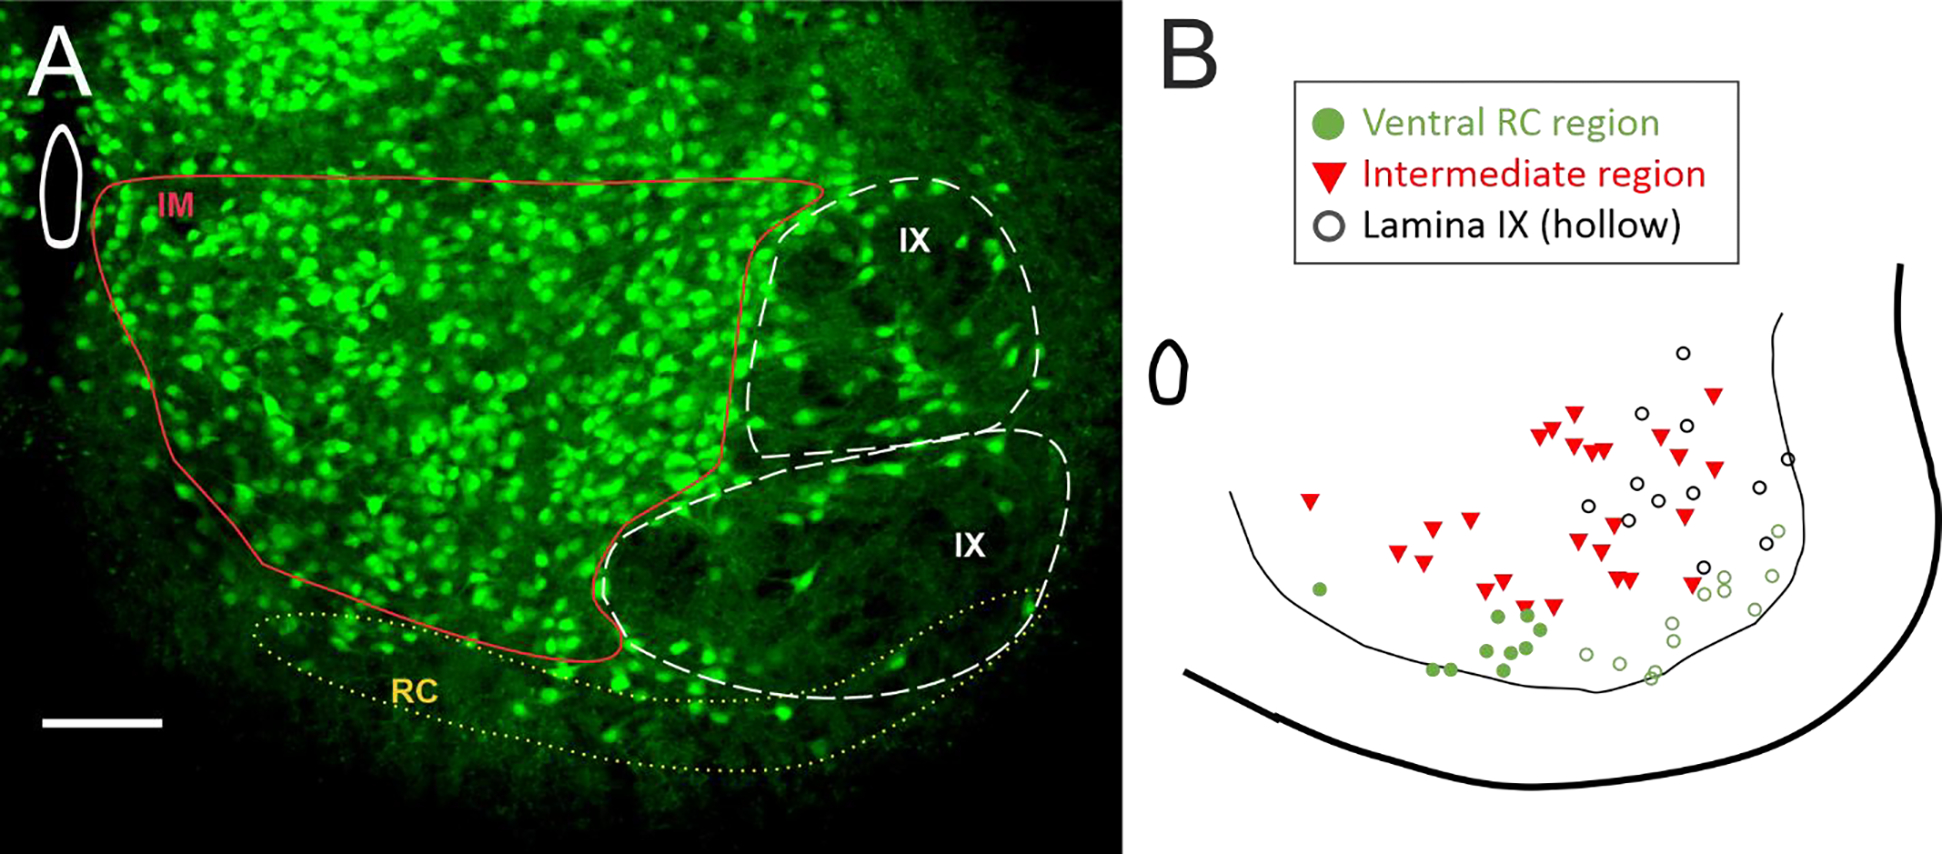
Figure 4: Regional divisions of interneurons.

(A) Three regions were used for analysis of regional differences in glycinergic interneurons. (B) Map of the patched interneurons coded for regions. Ventral region with RC cells (green circles) overlapped with lamina IX (hollow circles). The remaining interneurons that were not within the RC region or lamina IX were grouped into an intermediate region of lamina VII and VIII (red triangles). Scale bar in A = 100 μm.
