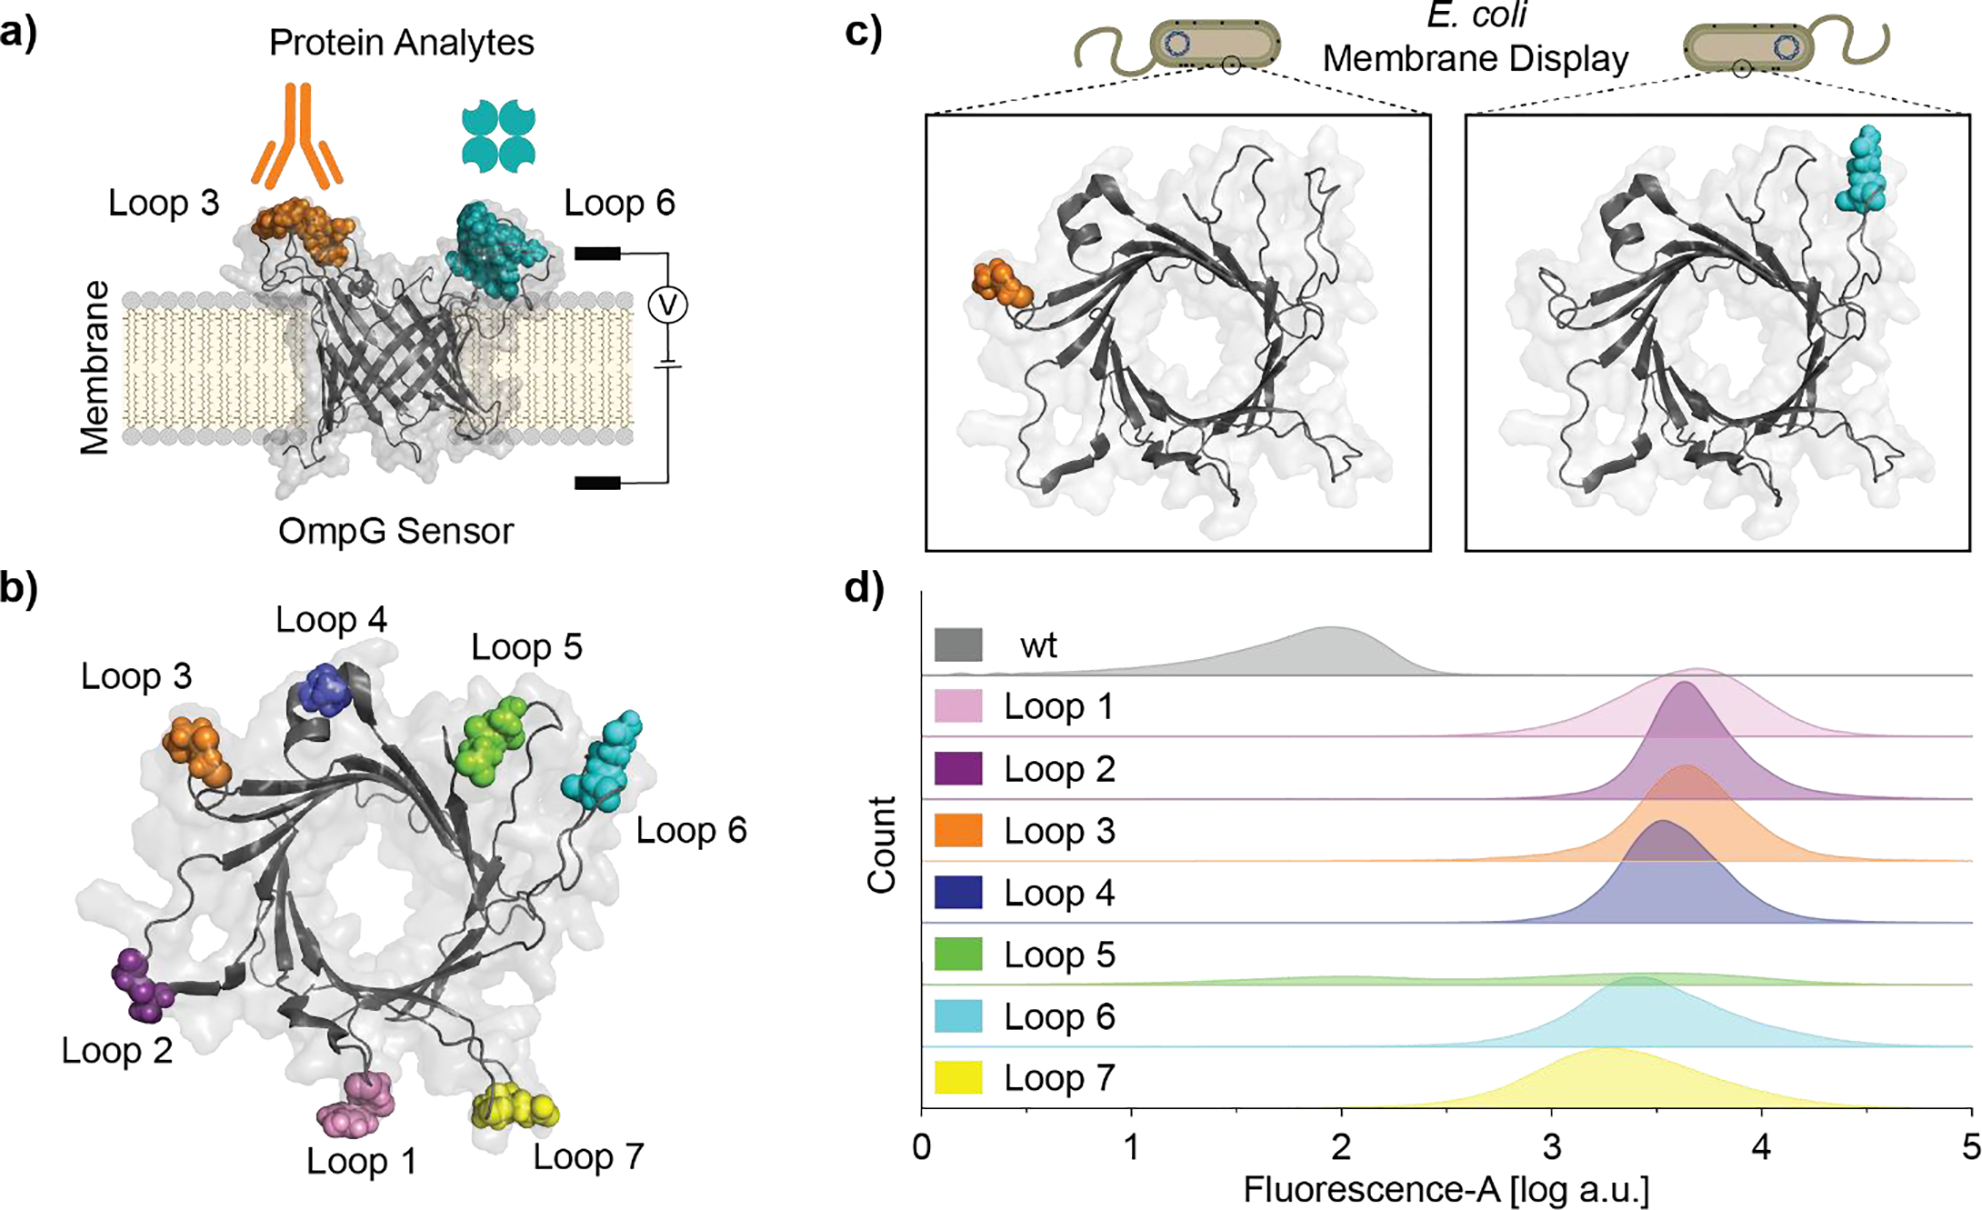
Figure 1.

OmpG loops demonstrate variable peptide display efficiency. a) Schematic of OmpG multiplex sensor for single-channel current recording. b) Top view of OmpG sensor, FLAG motif insertion site is indicated by colored spheres (PDB: 5MWV). c) Cartoon schematic of OmpG constructs displayed on E. coli outer membrane. d) Flow cytometry analysis of E. coli cells expressing OmpGLn-FLAG variants, data is presented as kernel density estimation of FITC-channel fluorescence event counts combined from biological triplicates.
