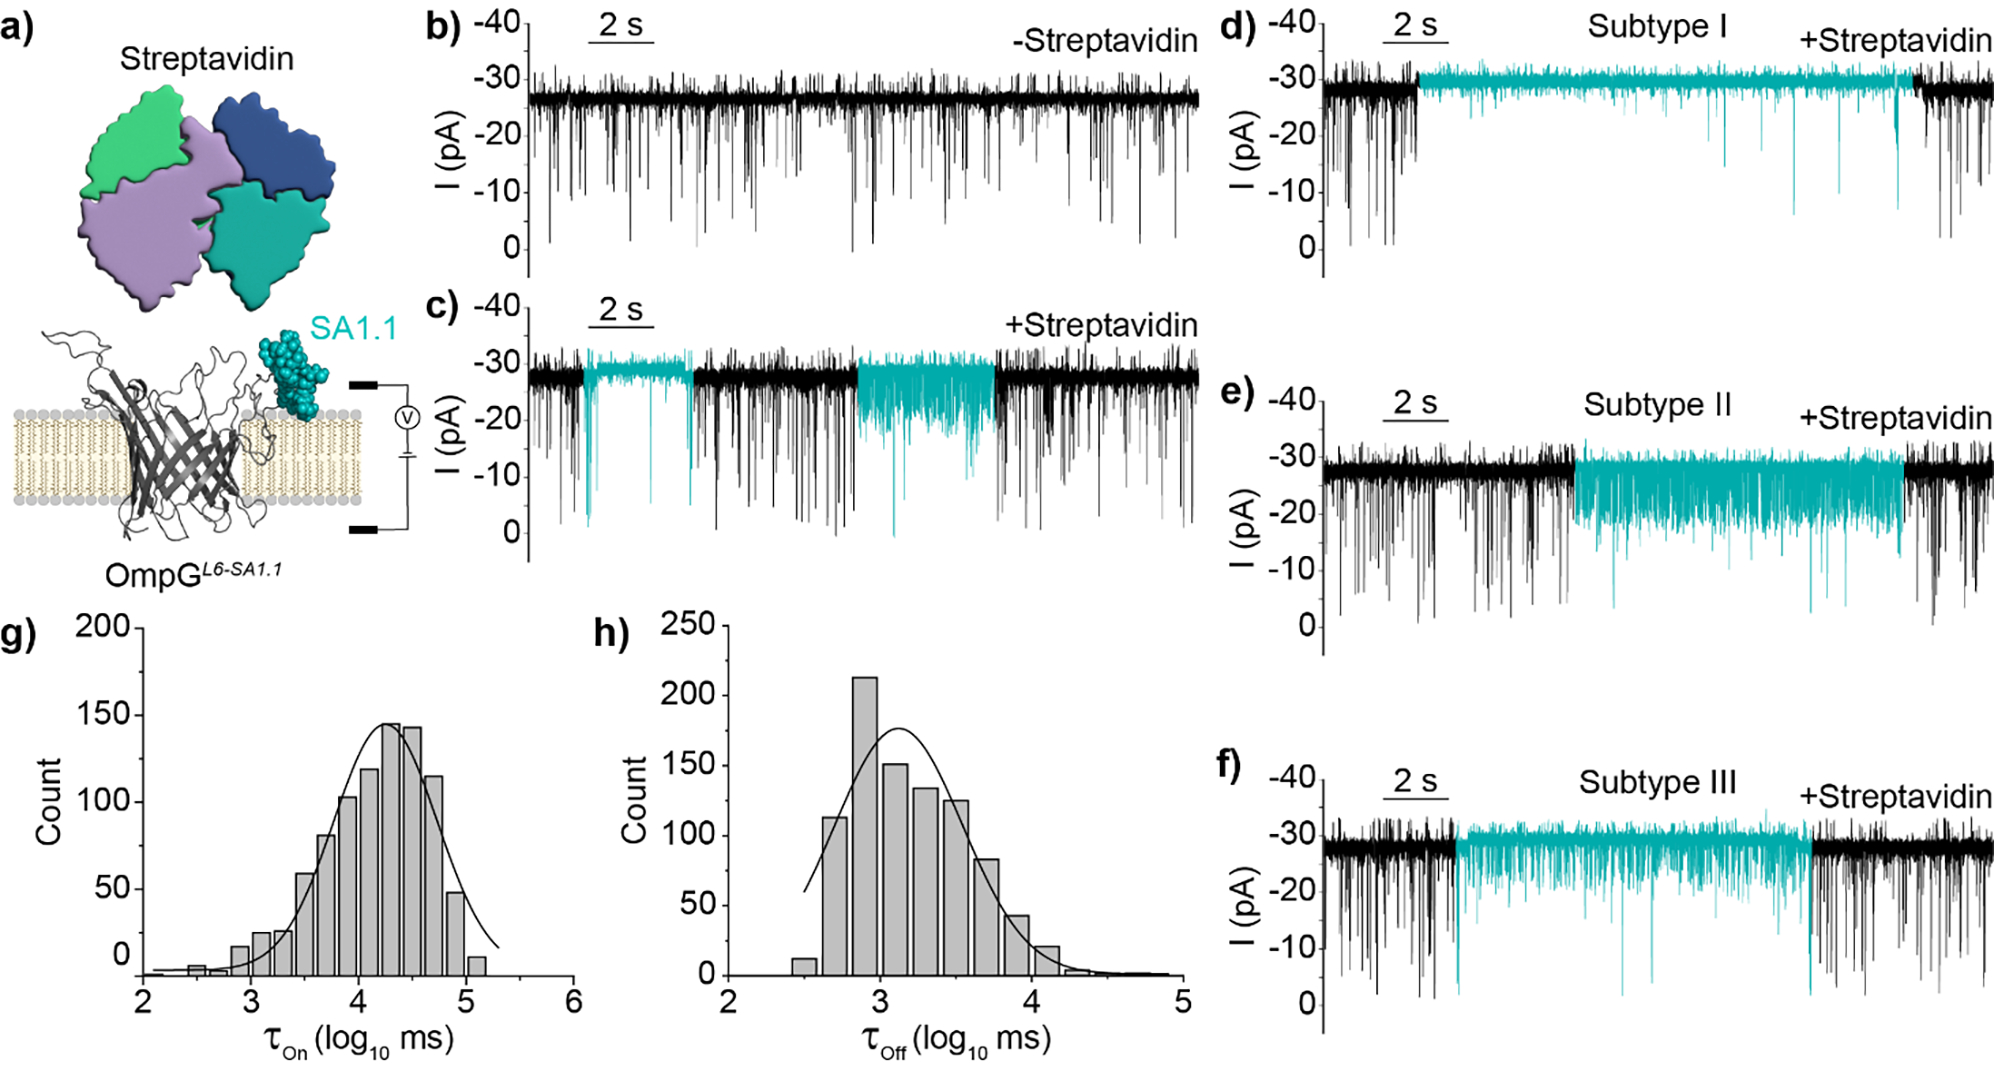
Figure 3.

Detection of Streptavidin by OmpGL6-SA1.1 nanopore. a) Schematic view of OmpGL6-SA1.1 sensor and analyte streptavidin. b-c) Representative traces of OmpGL6-SA1.1 in the absence and presence of streptavidin (800 nM). The regions of the trace demonstrating streptavidin binding signals are colored in blue. d-f) Representative traces of streptavidin binding Subtypes I-III. g-h) Black line shows gaussian fit of τon and τoff from log transformed millisecond values (N = 3, n = 903). Experiments were performed in 50 mM Na2HPO4 pH 6.0 buffer containing 300 mM KCl at an applied potential of ±50 mV. Traces were filtered using a 500 Hz lowpass digital gaussian filter.
