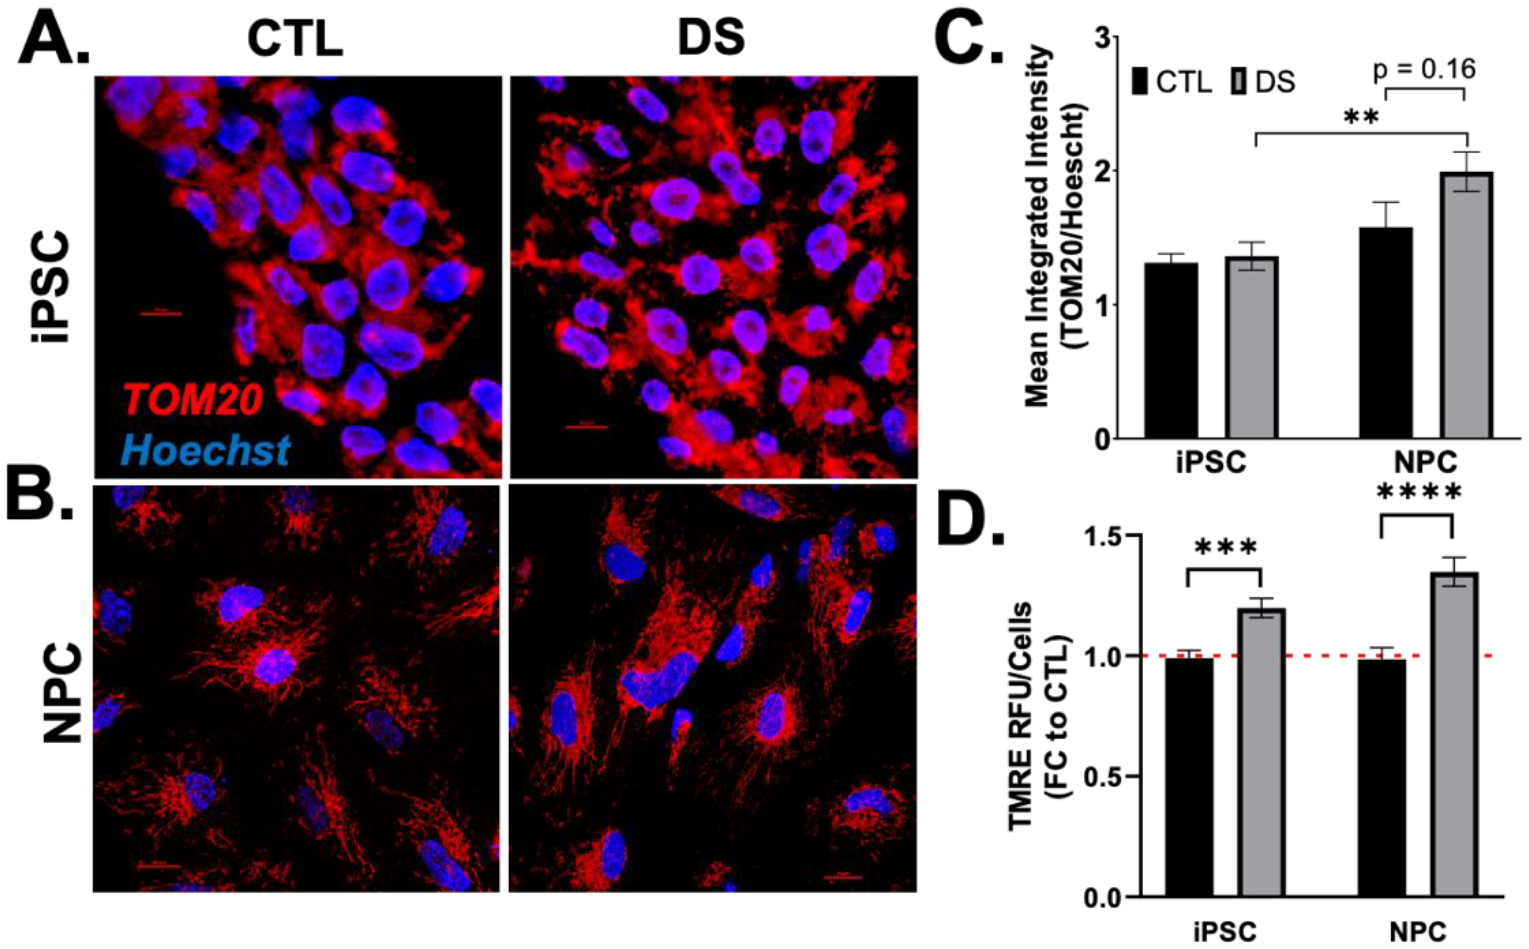
Figure 3. Early maturation of mitochondrial networks in DS cells.

Representative images of mitochondrial shape in DS and euploid iPSCs (A) and NPCs (B) by immunofluorescence detection of TOM20 at 60X magnification show no differences in TOM20 abundance (C). TMRE staining showed increased mitochondrial membrane potential in DS iPSCs and NPCs (D). Nuclei are stained with Hoescht. Bar = 10 μM. Results are expressed as mean +/− SEM. N = 30–40. ** = p ≤ 0.01, *** = p ≤ 0.001, **** = p ≤ 0.0001.
