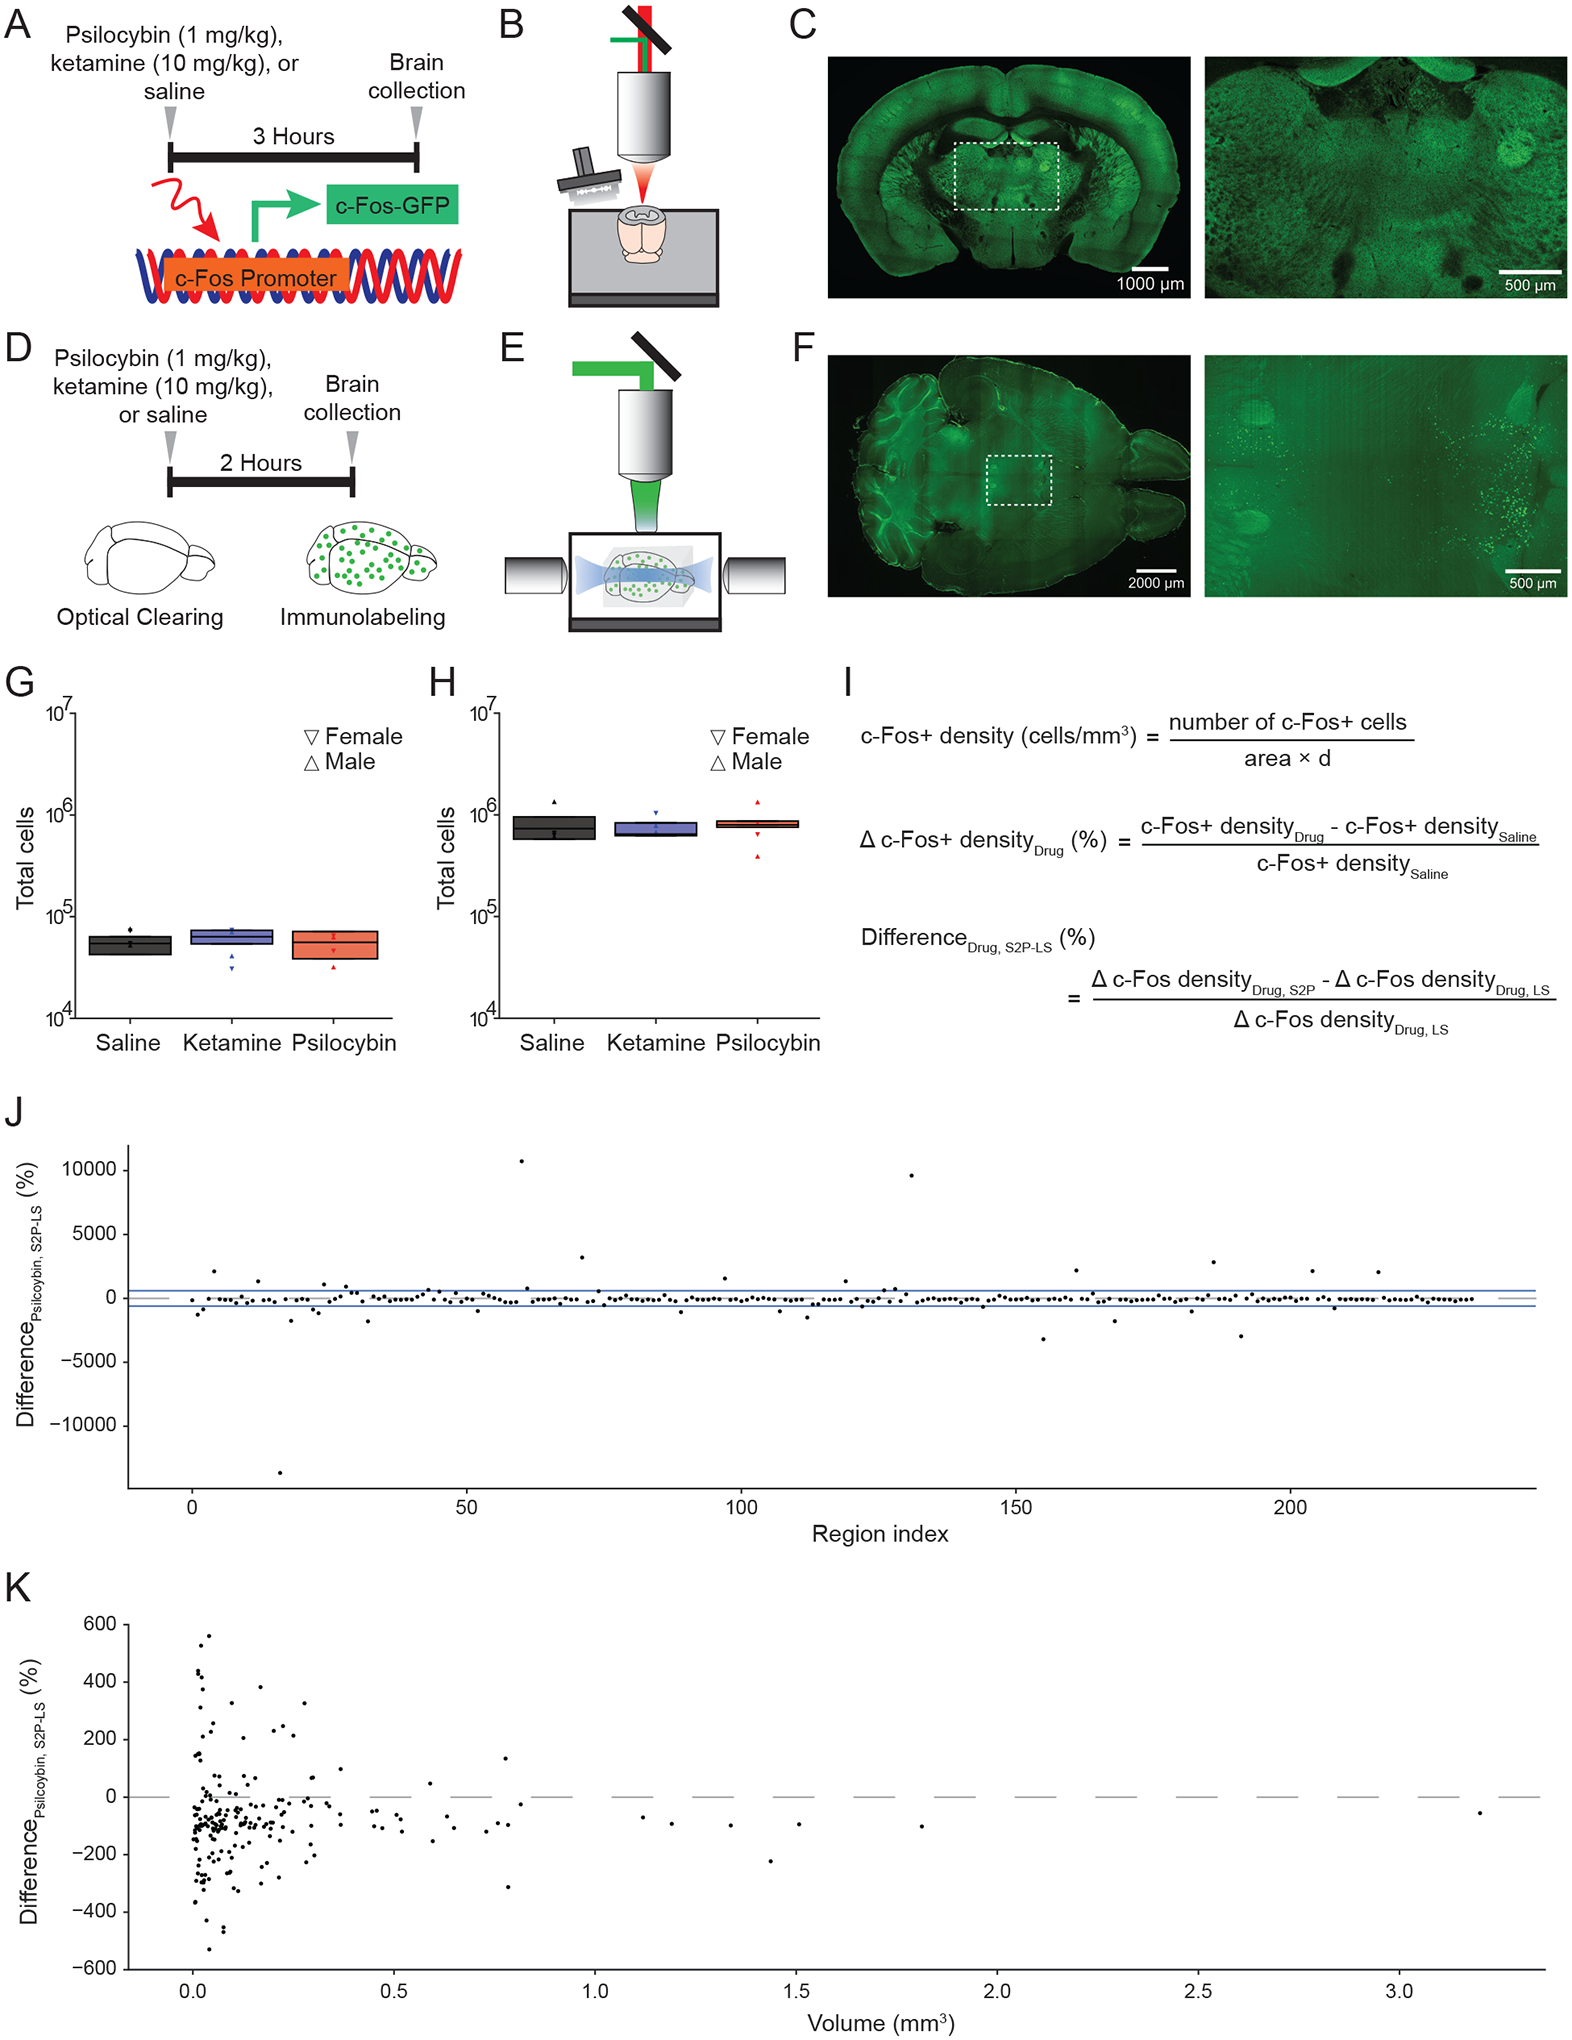
Figure 1. Whole-brain mapping of drug-induced c-Fos expression.

(A) Transgenic c-Fos-GFP mice were injected with either saline, ketamine (10 mg/kg), or psilocybin (1 mg/kg) at 3.5 hours before sacrifice and collection of brains (n = 4 per condition). (B) Schematic of the serial two-photon microscope setup. (C) Left: tiled image of a coronal block-face of a brain from c-Fos-GFP mouse. Right: zoomed in view demonstrating expression of c-Fos puncta in neurons. (D) C57/BL6 mice were injected with either saline, ketamine (10 mg/kg), or psilocybin (1 mg/kg) at 2 hours before sacrifice and collection of brains (n = 4 per condition). Brains were cleared and then immunolabeled with antibody against c-Fos protein. (E) Schematic of the light sheet microscope setup. (F) Left: image of a horizontal plane of a cleared mouse brain labeled with c-Fos antibody. Right: zoomed in view demonstrating expression of c-Fos puncta in neurons of the cortex. (G) Total number of c-Fos+ cells detected in the entire brain across different drug conditions using serial two-photon microscopy. Symbol, individual animal. Box plot shows the median, 25th and 75th percentiles. (H) Total number of c-Fos+ cells detected in the entire brain across different drug conditions using light sheet microscopy. Symbol, individual animal. Box plot shows the median, 25th and 75th percentiles. (I) Top: formula to calculate c-Fos+ cell density for a region. Middle: formula to calculate the change in c-Fos+ cell density due to drug compared to saline. Bottom: formula to calculate difference in drug-evoked change in c-Fos+ cell density between the two imaging modalities. S2P, serial two-photon microscopy. LS, light sheet microscopy. (J) Difference in psilocybin-evoked change in c-Fos+ cell density between the two imaging modalities, plotted by brain region. Region indices are listed in Supporting Table 1. Blue lines, threshold for exclusion. Dashed line, zero percent difference. (K) Difference in psilocybin-evoked change in c-Fos+ cell density between the two imaging modalities, plotted as a function of the volume of brain region as assessed by serial two-photon microscopy. Dashed line, zero percent difference.
