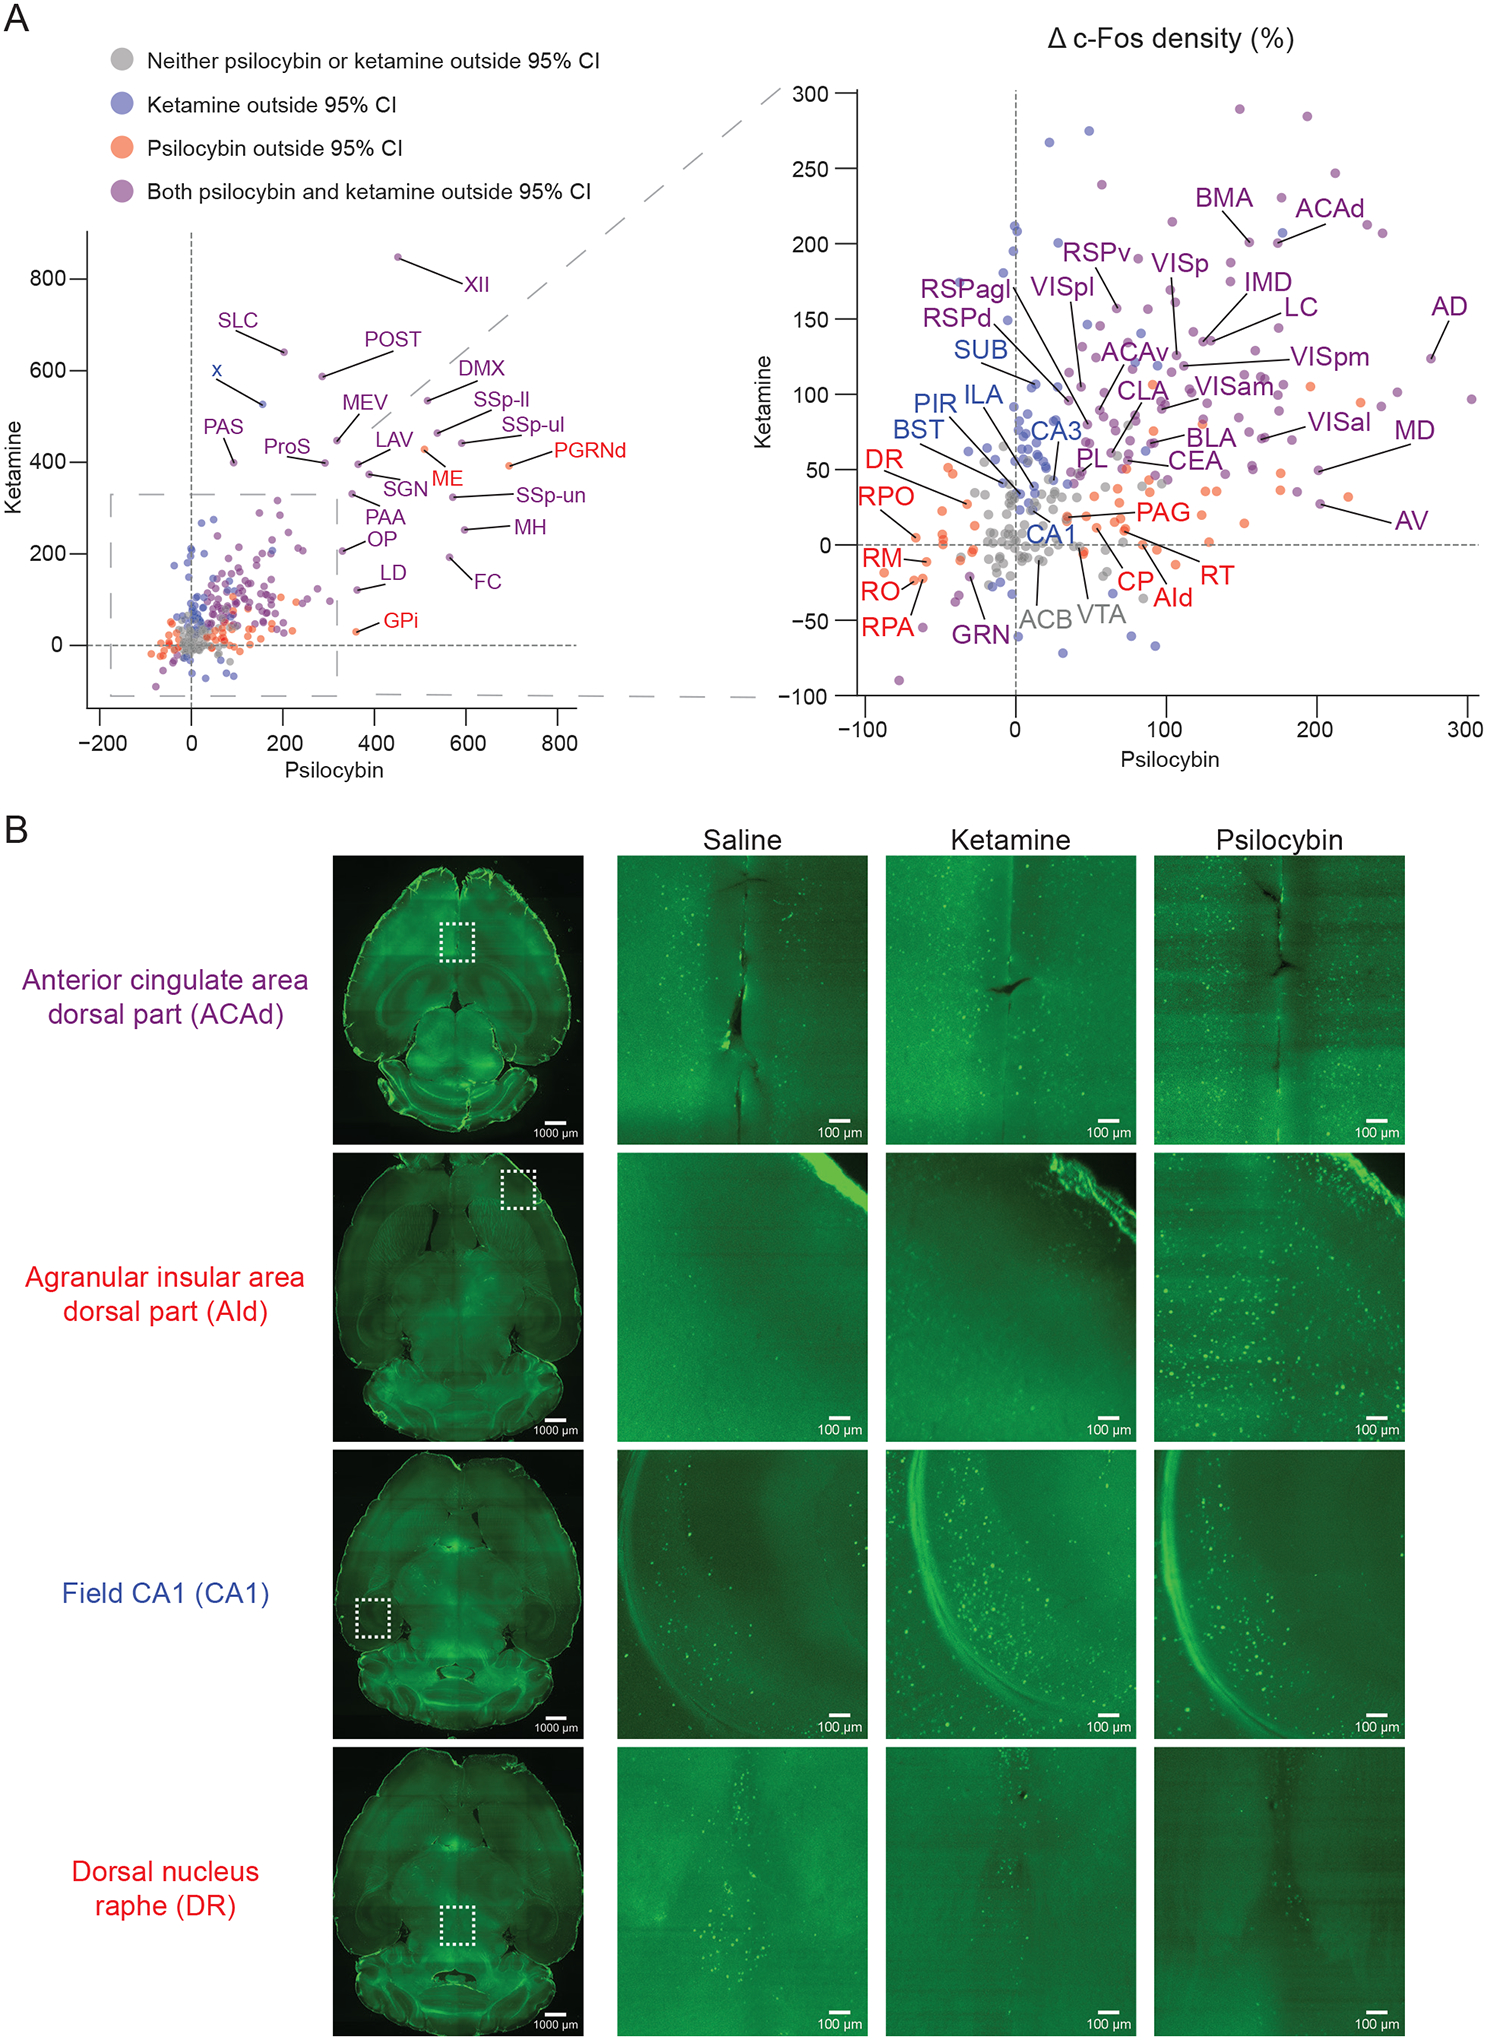
Figure 3. Common and distinct regions targeted for c-Fos expression by psilocybin and ketamine.

(A) Scatter plot of mean drug-evoked percent change in c-Fos+ density for psilocybin (x-axis) versus ketamine (y-axis). For list of abbreviations, see Supporting Table 3. (B) Example images from light sheet microscopy for select cortical and subcortical brain areas. Due to background intensity, for visualization purposes, we performed gamma correction on the magnified images, using the same adjustment for each row of images.
