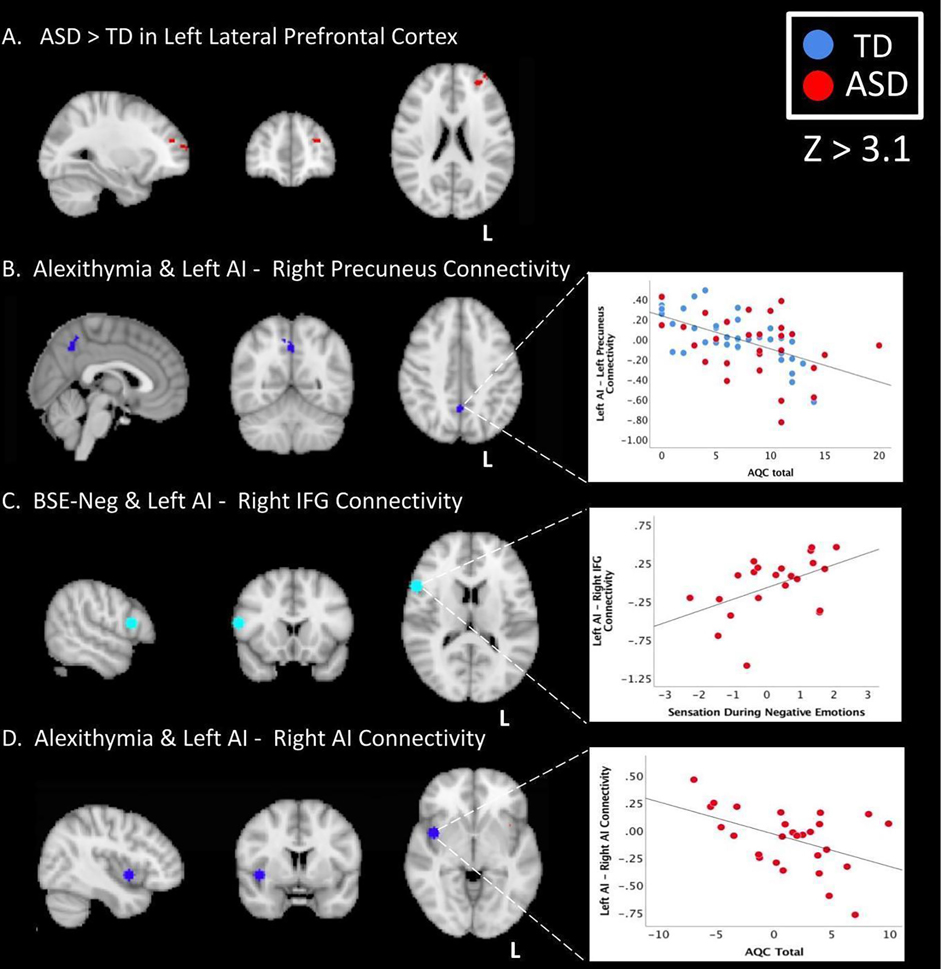
Figure 2. Group Differences and Significant Correlations.
(A.) Whole brain results showing ASD>TD connectivity between the left AI and left lateral prefrontal cortex (X = −28, Y = 47, Z = 21) during non-emotional facial expressions (B.) Negative whole brain correlation with AQC total score and connectivity between the left AI and right precuneus (X = 1, Y = 55, Z = 42) when viewing all facial expressions across all participants (C.) Correlation between left anterior insula and right IFGop (X = 17, Y = 71, Z = 43) connectivity with BSE-neg in the ASD group during emotional facial expressions; (D.) Correlation between AQC total score and connectivity between left anterior insula and right AI (X = 24, Y = 65, Z = 34) in the ASD group during viewing all facial expressions. L= left; AI = anterior insula, IFGop = inferior frontal gyrus pars opercularis; AQC = Alexithymia Questionnaire for Children; BSE-neg = bodily sensation experienced during negative emotions; TD = typically developing; ASD = autism spectrum disorder

