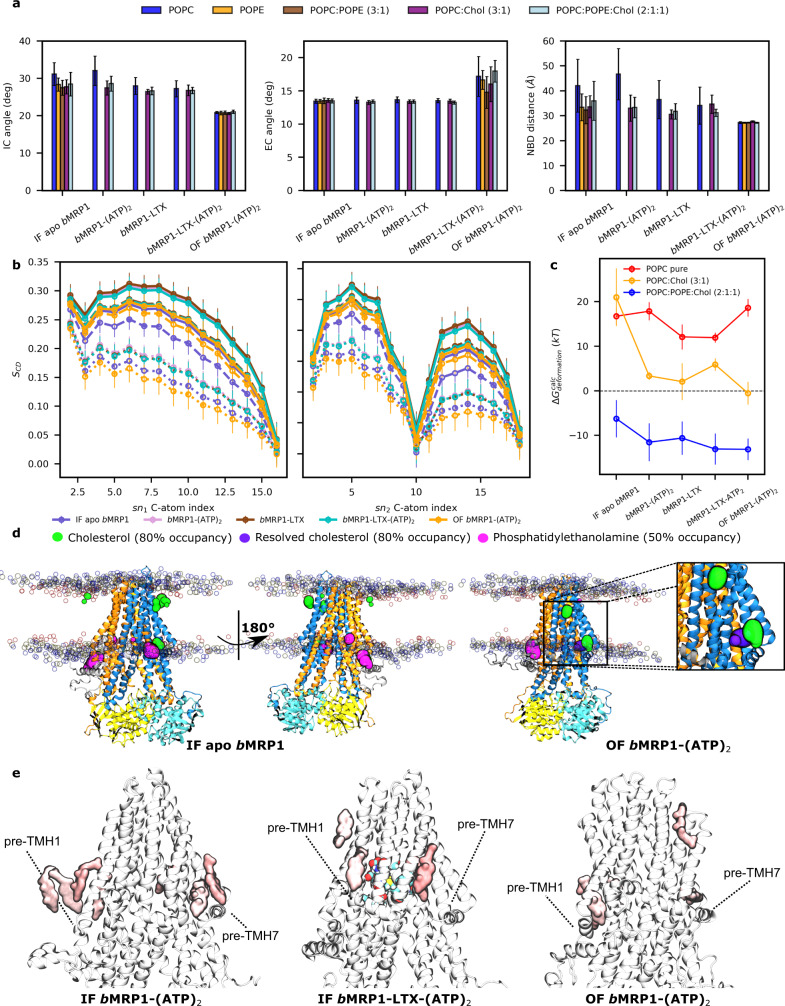
Fig. 4. Interplay between bMRP1 structural dynamics and lipid bilayer according to its composition.
a Average IC angle, EC angle and NBD distance for all bMRP1 systems embedded in different lipid bilayers calculated from n = 3 MD trajectories per state and lipid bilayer. Error bar refers to as standard deviations of each dataset. b Calculated C-atom lipid tail order parameters (SCD) for palmitic (sn1) and oleic tails (sn2) for all systems embedded in POPC-based models. Solid, dashed and dotted lines respectively depict lipid order parameters obtained in POPC:POPE:Chol (2:1:1), POPC:Chol (3:1) and POPC lipid bilayer models. Error bar refers to as standard deviations of each calculated dataset. c Calculated membrane free energy deformations30 obtained by averaging over n = 3 MD trajectories, considering each replica independently. Raw data are available in Supplementary Tables 10–12. Error bars refers to as standard deviation over the three independent replicas. d Calculated binding hotspots obtained from cholesterol and PE lipids defined by presence likelihood higher than 80 and 50% respectively for cholesterol and PE lipids. Zoom on Cryo-EM resolved cholesterol (violet) is shown to highlight the specific parallel orientation with respect to the lipid bilayer. e Important lipid areas based on allosteric pathway analysis. The location of key cholesterol molecules involved in the allosteric communication between substrate-binding pocket and NBSs is shown. Both NBSs are considered, highlighting the expected central roles of L0, pre-TMH1 and pre-TMH7 regions in specific lipid-protein interactions which might favour bMRP1 function.

