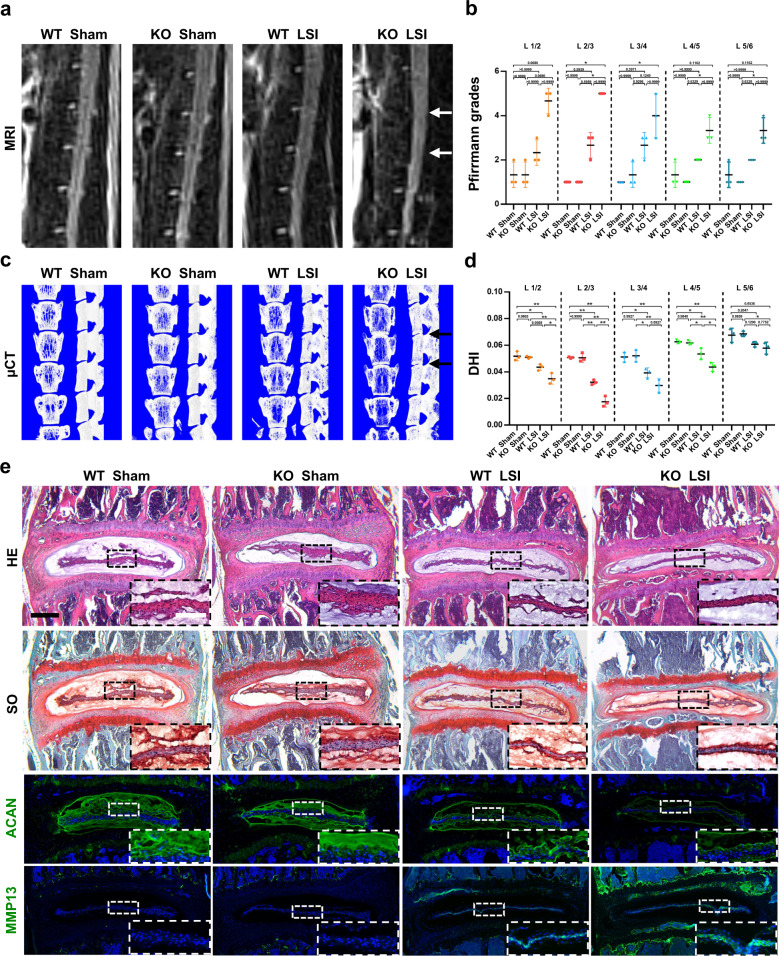
Fig. 3. Sirt5 KO mice exhibit a more severe degenerative phenotype of IVDs after LSI surgery.
An LSI model was used to induce IDD in 10-week-old WT and Sirt5 KO mice. WT sham group, KO sham group, WT LSI group, and KO LSI group (n = 3). a, b Representative MRI scan and statistical graphs of Pfirrmann grades of the mouse lumbar spine (2 months after surgery, n = 3). White arrows: L2/3 and L3/4 IVDs. c, d Representative µCT scans and quantification of DHI of the mouse lumbar spine (2 months after surgery, n = 3). Black arrows: L2/3 and L3/4 IVDs. e Representative images of HE, SO, and immunofluorescence staining of Aggrecan and MMP13 of the mouse lumbar spine IVDs (2 months after surgery, n = 3). Black scale bar = 50 μm; white scale bar = 20 μm. Differences among multiple groups were analyzed by one-way ANOVA, while Pfirrmann grades were analyzed by Kruskal‒Wallis h-tests. The data in the figures represent the mean ± S.D. The P value is shown, *P < 0.05, **P < 0.01.

