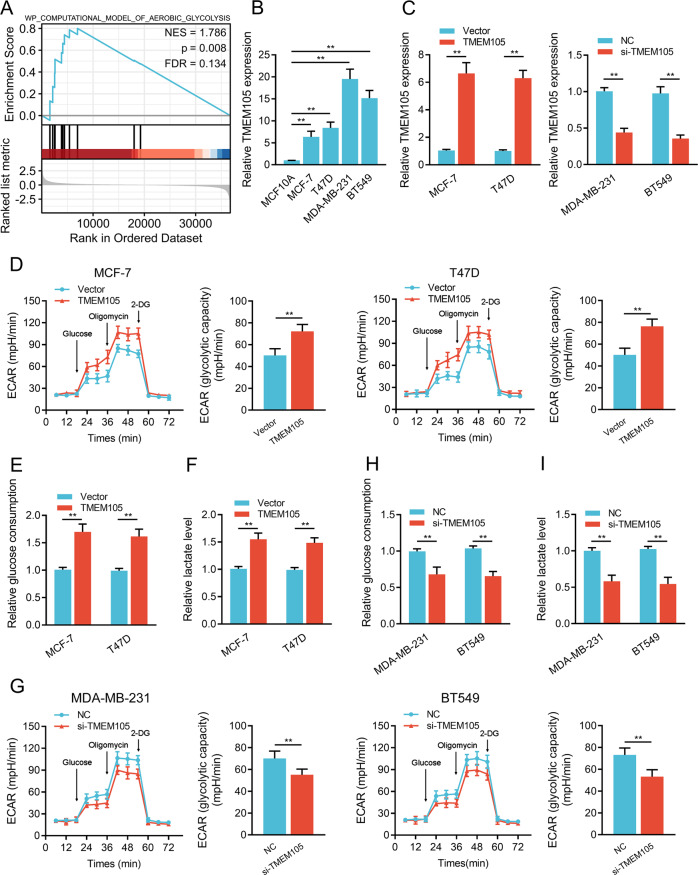
Fig. 2. TMEM105 facilitates glycolysis in breast cancer cells.
A GSEA analysis showed the different gene set between TMEM105-high and TMEM105-low of breast cancer patients in the TCGA dataset. NES normalized enrichment score, FDR false discovery rate. B Expression of TMEM105 was determined by qRT-PCR in MCF10A, MCF-7, T47D, MDA-MB-231, and BT549 cells. C Effects of overexpression or knockdown of TMEM105 in breast cancer cells as shown by qRT-PCR. ECAR level (D), glucose consumption (E), and lactate production (F) were determined after TMEM105 overexpression in MCF-7 and T47D cells. ECAR level (G), glucose consumption (H), and lactate production (I) were measured after the knockdown of TMEM105 in MDA-MB-231 and BT549 cells. 2-DG 2-deoxyglucose. **p < 0.01.

