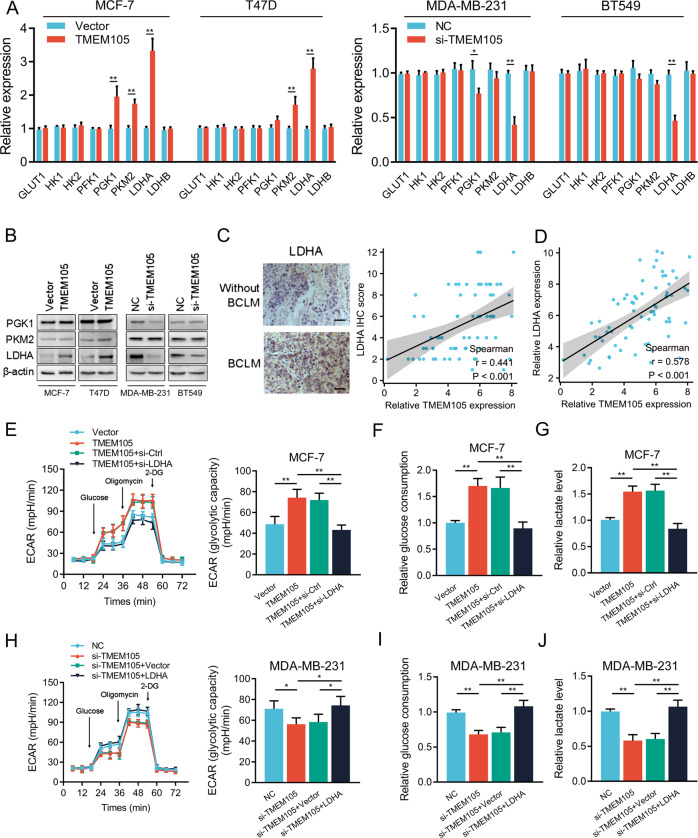
Fig. 3. TMEM105 enhances glycolysis in breast cancer cells by promoting LDHA expression.
A Expression of glycolysis-related genes in TMEM105-overexpressing MCF-7 and T47D cells as well as in TMEM105-knockdown MDA-MB-231 and BT549 cells. B Western blot analysis of PGK1, PKM2, and LDHA in TMEM105-overexpressing MCF-7 and T47D cells as well as in TMEM105-knockdown MDA-MB-231 and BT549 cells. C Representative immunohistochemical staining for LDHA expression in breast cancer tissues without or with BCLM. Spearman’s correlation between TMEM105 and LDHA expression in breast cancer tissues of the patients in the Hebei dataset (n = 68). Scale bars, 50 μm. D The correlation between TMEM105 and LDHA expression determined by qRT-PCR in breast cancer tissues in the Hebei dataset. ECAR level (E), glucose consumption (F), and lactate production (G) were determined in TMEM105-overexpressing MCF-7 cells. ECAR level (H), glucose consumption (I), and lactate production (J) were determined in TMEM105-knockdown MDA-MB-231 cells. *p < 0.05, **p < 0.01.

