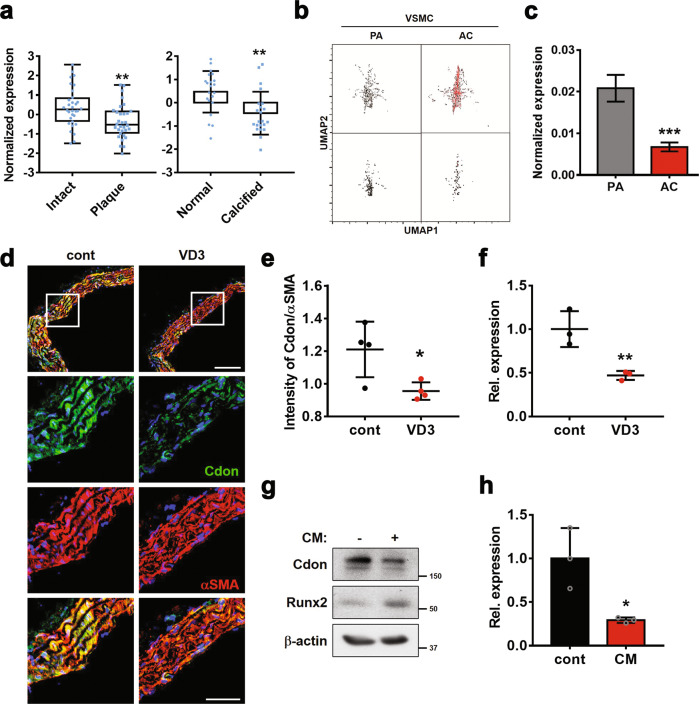
Fig. 1. Cdon expression is reduced in calcified aortas.
a Scatterplots of Cdon expression in aortic samples from patients with atherosclerotic plaques (GSE43292, n = 32) and calcified aortas (GSE12644 and GSE83453, n = 22). Statistical significance was determined with a two-tailed Student’s t-test. **P < 0.01. b Uniform manifold approximation and projection (UMAP) visualization of VSMCs (upper box: all genes in VSMCs, bottom box: only Cdon expression in VSMCs) in calcified atherosclerotic core plaques (AC) and patient-matched proximal adjacent portions (PA) of the carotid artery (GSE159677, n = 3). c Cdon expression in PA VSMCs and AC VSMCs (n = 3). Statistical significance was determined with a two-tailed Student’s t-test. ***P < 0.005. d Representative immunostaining images of Cdon and αSMA in aortas injected with VD3. Scale bar: 100 μm (top) and 50 μm (bottom). e Quantification of the intensity of Cdon fluorescence normalized to the intensity of αSMA, as shown in Panel d (n = 4). Data represent the means ± SEMs analyzed by Student’s t-test. *P < 0.05. f Relative RNA expression level of Cdon in aortic samples from VD3-injected mice (n = 3). Data represent the means ± SEMs analyzed by Student’s t-test. **P < 0.01. g Immunoblot analysis of VSMCs cultured with CM. h The relative RNA expression of Cdon in CM-treated VSMCs. Data represent the means ± SEMs analyzed by Student’s t-test. *P < 0.05.

