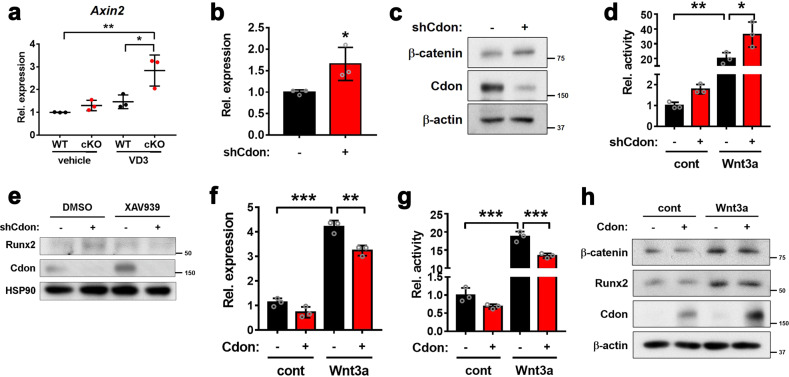
Fig. 5. Cdon-depleted VSMCs activate the Wnt signaling pathway.
a Relative Axin2 transcript levels in the vehicle- and VD3-treated aortas (n = 3). Data represent the means ± SEMs analyzed by one-way ANOVA. *P < 0.05, **P < 0.01. b Relative Axin2 transcript levels in the control or Cdon-deficient cells (n = 3). Data represent the means ± SEMs analyzed by Student’s t-test. *P < 0.05. c Immunoblot analysis of the shCont- or shCdon lentivirus-infected VSMCs. d Top-flash reporter activity of the control or Cdon-depleted VSMCs in response to Wnt3a (n = 3). Data represent the means ± SEMs analyzed by one-way ANOVA. *P < 0.05, **P < 0.01. e Immunoblot analysis of the shCont- or shCdon-infected VSMCs in response to DMSO or XAV939. f Relative Axin2 expression in control- or Cdon-overexpressing VSMCs treated with Wnt3a (n = 3). Data represent the means ± SEMs analyzed by one-way ANOVA. **P < 0.01, ***P < 0.005. g The TopFlash reporter activity of the control- or Cdon-overexpressing VSMCs in response to Wnt3a (n = 3). Data represent the means ± SEMs analyzed by Student’s t-test and one-way ANOVA. ***P < 0.005. h Immunoblot analysis of the control- or Cdon-overexpressing VSMCs in response to Wnt3a.

