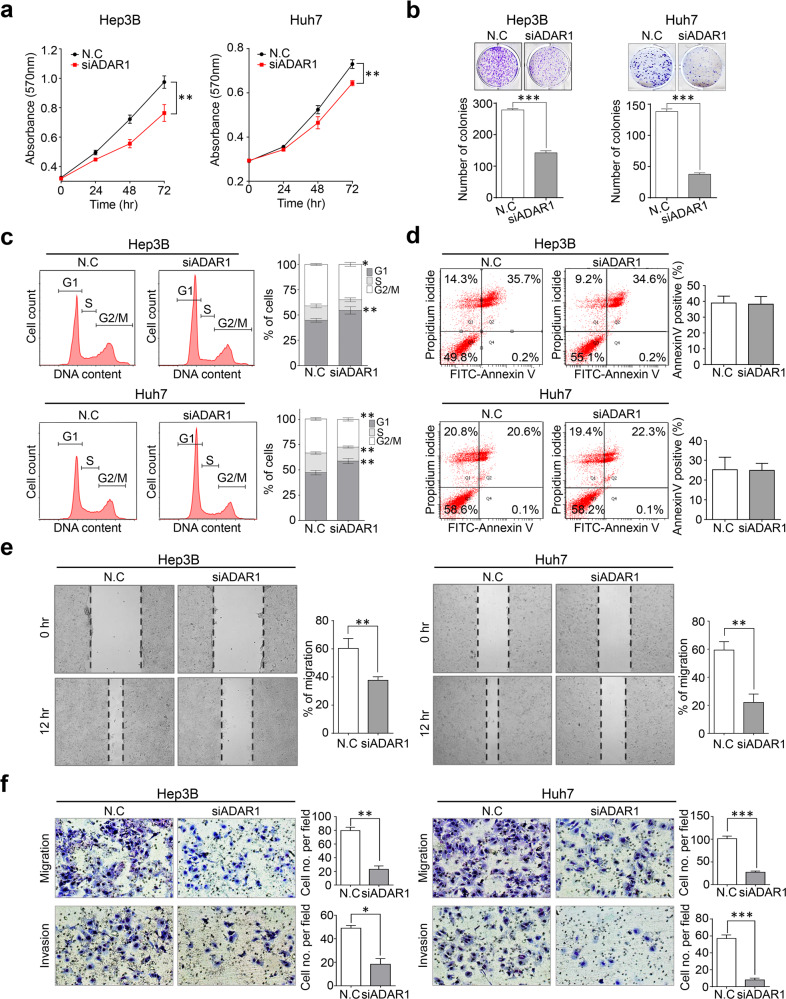
Fig. 2. Targeted inactivation of ADAR1 suppresses the tumorigenic potential of liver cells.
a Cell growth was measured by MTT assay. b Anchorage-independent growth was determined by clonogenic assay. c Flow cytometry with propidium iodide (PI)-positive cells after treatment with control siRNA (N.C.) and ADAR1-specific siRNA (siADAR1), respectively (left). The PI-stained cell number to total cell number ratios are presented with a bar graph (right). d The apoptosis rates of the cancer cells stained with annexin V-FITC and propidium iodide were evaluated after ADAR1 knockdown via flow cytometry (left). The annexin V-FITC-stained cell number to total cell number ratios are presented with a bar graph (right). e Scratch wound-healing assay (left), and the ratios of the remaining gap size to the original gap size are represented with a bar graph (right). f Transwell migration and invasion assays. All data are shown as the mean ± SEM. *P < 0.05, **P < 0.01, ***P < 0.001 by unpaired Student’s t-test.

