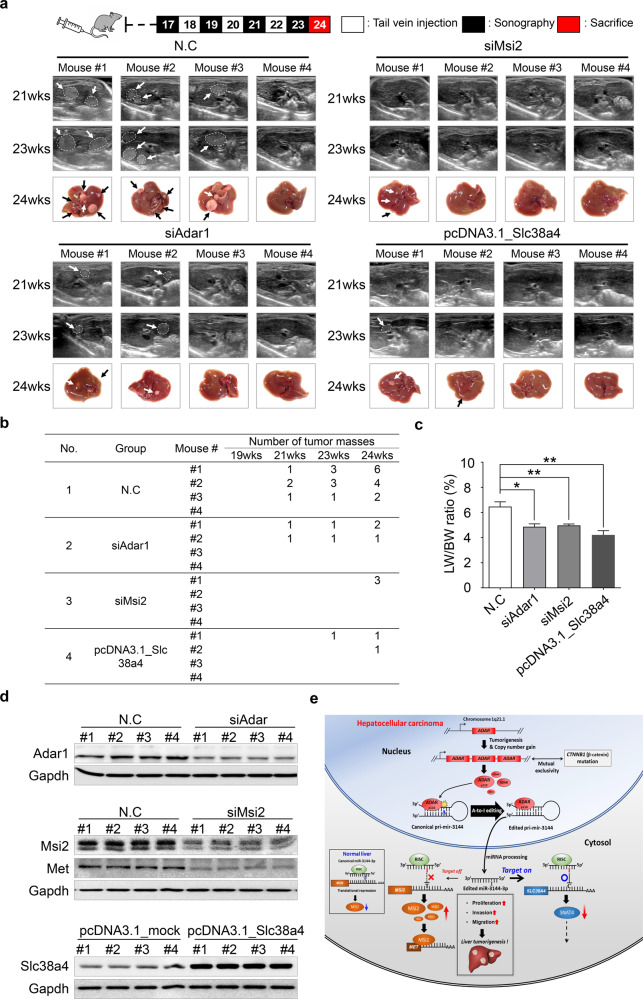
Fig. 7. In vivo validation of ADAR1, MSI2, and SLC38A4 in mice.
a Timeline of in the in vivo transfection of siAdar1, siMsi2, and pcDNA3.1_Slc38a4 in an H-ras-transgenic mouse model (upper). Representative ultrasonography images of the mouse liver cancer models at 21 and 23 weeks of age. Liver images taken at 24 weeks of age (lower). b The number of tumor masses in each mouse at the indicated weeks of age are listed in the table. c Bar chart showing the liver weight (LW) and body weight (BW) ratio (%) in each group. d Western blot analysis showing Adar1, Msi2, Met, and Slc38a4 expression in the H-ras-transgenic mice. Gapdh was used as the loading control. All data are shown as the mean ± SEM; *P < 0.05, **P < 0.01 by unpaired Student’s t-test. e Schematic showing the miR-3144-3p on target and off-target mechanisms induced by A-to-I RNA editing of upregulated ADAR1-p110 during liver cancer development.

