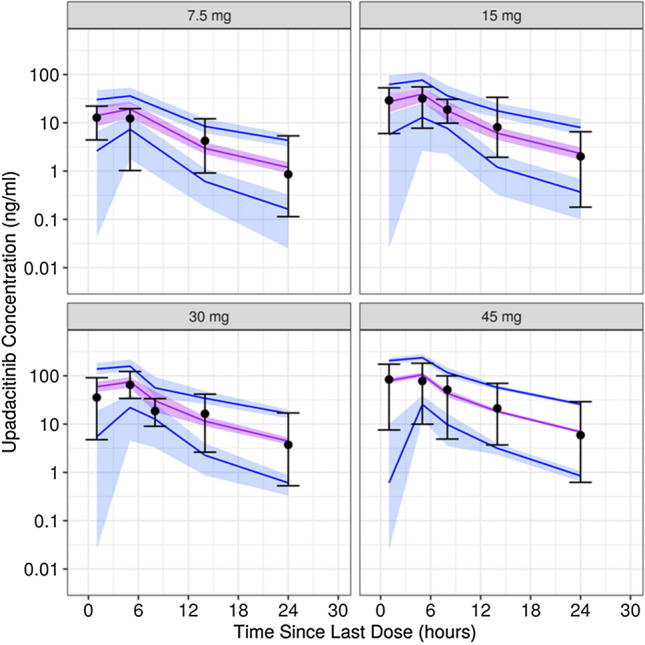
Fig. 2.

Visual predictive checks of upadacitinib concentration in patients with ulcerative colitis (UC) (induction studies: 1, 2, and 4) stratified by dose group. The blue lines represent the 90% prediction interval of the model, the shaded blue areas represent the associated 90% confidence intervals of the 5th and 95th percentiles of simulated concentrations. The purple line represents the predicted median, the purple shaded area its 90% confidence interval. The dots and error bars are the median and 90% inter-percentile range (5th to 95th percentile) of the observed data. Note: Time bins were chosen at 1, 5, 8, 14, and 24 h after last dose for the 15, 30, and 45 mg groups and at 1, 5, 14, and 24 h after the last dose for the 7.5mg group as there are no observed records at 8 h after the last dose
