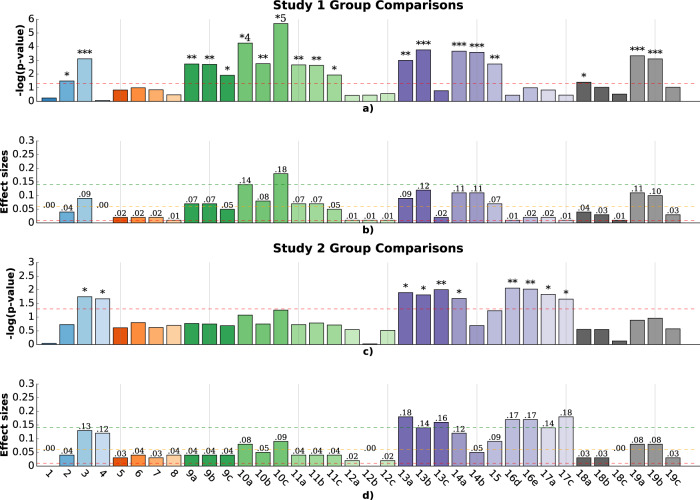
Fig. 1. P-values and associated effect sizes for group comparisons of the touch-related features for autistic versus neurotypical participants in study 1, and autistic participants with and without co-occurring ADHD in study 2.
(1) number of touches; (2) number of pops; (3) bubble popping rate; (4) double touch rate; (5) screen exploratory percentage; (6) number of targeted; (7) number of transitions; (8) repeat percentage; (9) touch duration; (10) touch length of the touch motion; (11) touch velocity; (12) applied force; (13) distance to the center; (14) popping accuracy; (15) average variation of the popping accuracy; (16d) variability of the average popping accuracy; (16e) variability of the maximum popping accuracy; (17) number of touches per target; (18) touch frequency; (19) time spent on a targeted bubble. a Mean; b Median; c Standard deviation; *p < 0.05; **p < 0.01; ***p < 0.001; *4:p < 0.00001; *5:p < 0.000001. P-values were computed using a one-way ANCOVA. Red dotted line indicates statistical significance at level 5%. P-values were corrected using Benjamini–Hochberg procedure to control for FDR. Red, orange, and green dotted lines indicate standard levels associated with a low (η2 = .01), middle (η2 = .04), and large (η2 = .14) effect size.

