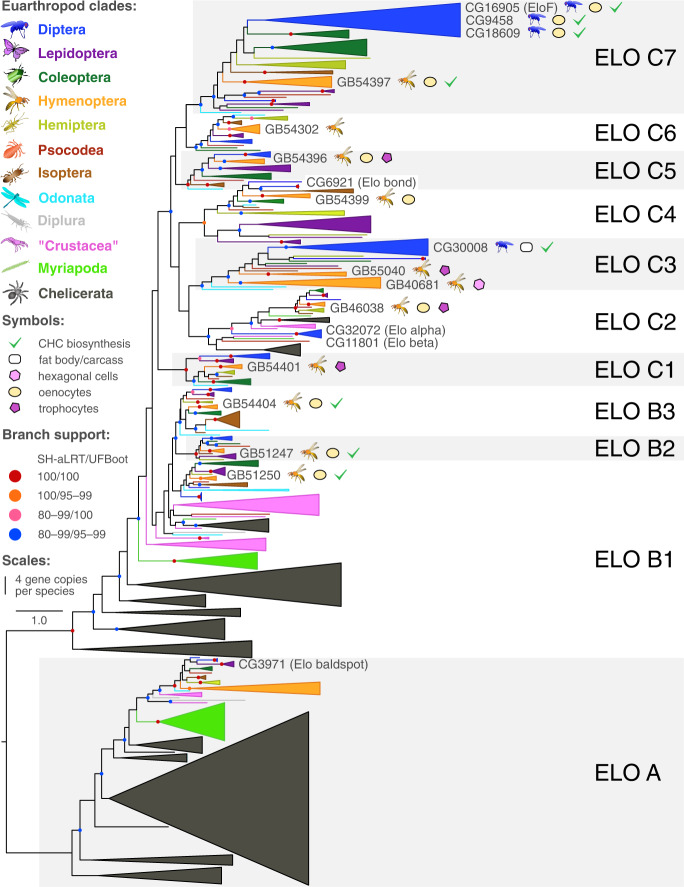
Fig. 2. Gene tree of fatty acid elongases from 37 species of Euarthropoda showing copy numbers and involvement of genes in CHC biosynthesis.
Branch support was calculated from ultrafast bootstrap (UFBoot2) replicates (in %) and Shimodaira-Hasegawa approximate likelihood ratio tests (SH-aLRT in %). Supported branches are represented by a color circle, whereas those with SH-aLRT<80% and UFBoot<95% do not have a circle. The width of each clade represents the number of gene copies per species (single copies represented by a line).

